
The integration of MenthorQ into the Tickblaze platform is more than a technical upgrade—it’s a strategic inflection point for traders who want access to the same tools that institutions rely on. For the first time, retail traders can harness real-time gamma analytics, zero-DTE impact zones, swing forecasts, skew sentiment, and institutional-grade volatility modeling—without writing a single line of code.
This guide offers a complete breakdown of the MenthorQ + Tickblaze integration, covering not only what each tool does but also how to use them in practical trading workflows.
Partnership Overview and Strategic Purpose
The vision is clear: deliver a full suite of institutional-grade tools that simplify complex options data into usable, high-probability trading signals for futures, index, and equity traders.
MenthorQ is built around three principles: ingest large-scale options and futures data, simplify it through intuitive models, and present it as actionable trading signals. This collaboration embeds those tools directly inside the Tickblaze environment.
Options Data Is Now a Leading Indicator
Since 2020, options volume has surged past equities on many trading days. Institutional positioning in the options market now sets the tone for broader market moves. Retail traders often miss this because they don’t use options data—either due to complexity or lack of access.
MenthorQ simplifies that layer. Even traders who never place an options order can use this data to anticipate volatility, identify turning points, and trade with institutional flow, not against it.
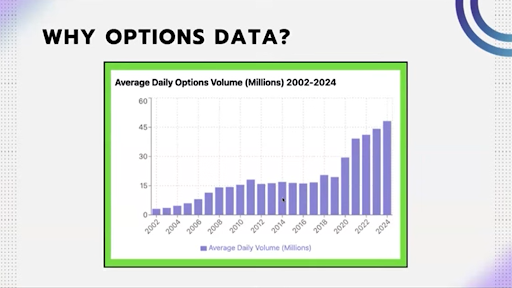
Visual chart of options volume compared to equity volume growth since 2020.
Gamma Levels: Mapping Market Maker Reactions
Gamma levels are the foundation of MenthorQ’s system. These levels show where market makers are likely to hedge aggressively, often leading to price reversals or momentum breaks.
Key Levels:
- Core Resistance: Where call option gamma is highest, often capping rallies
- Put Support: Where put gamma is highest, often acting as a price floor
- HVL (High Volatility Level): The gamma flip zone, marking transitions between positive and negative gamma
- JX1 through JX10: Secondary gamma reaction zones
- One Day Min/Max: Daily price range based on implied volatility
- Zero-DTE levels: Gamma zones tied to same-day options expiration
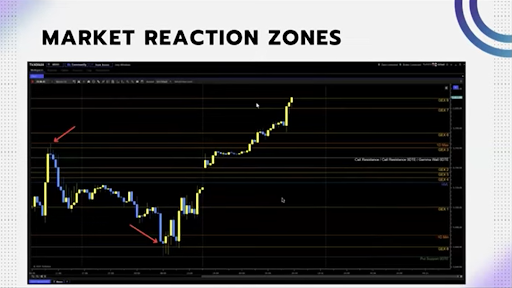 Tickblaze chart showing Core Resistance and Put Support plotted using MenthorQ integration.
Zero-DTE Options: Volatility Catalysts
Zero Days to Expiration (0-DTE) options now dominate intraday flows, especially in indices and futures markets. These short-dated contracts can trigger violent price reactions, particularly when they move from out-of-the-money to in-the-money.
MenthorQ tracks 0-DTE gamma in real time. As market makers adjust their hedges in response to price movement, traders can anticipate volatility spikes and sudden directional shifts. Patrick explained how institutions often “battle” at 0-DTE levels. While intent may not be clear at the open, the day’s price action typically validates the level.
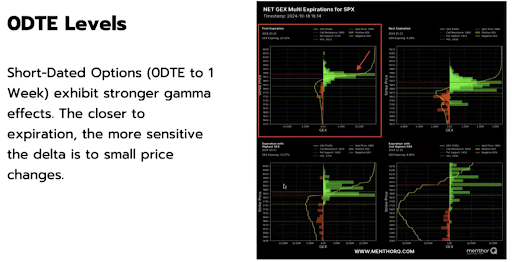 Real-time gamma chart showing price response at Zero-DTE level with strong institutional reaction.
High Volatility Level (HVL): The Gamma Flip Zone
The HVL marks the transition between market-stabilizing and market-amplifying conditions. In positive gamma, market makers buy as prices fall and sell as they rise—reducing volatility. In negative gamma, they do the opposite—amplifying movement.
MenthorQ described HVL Zero-DTE as an “ATM machine” due to its reliability in producing trades that move toward One Day Min/Max levels. In his personal trading journal, this setup yields a 75 percent win rate.
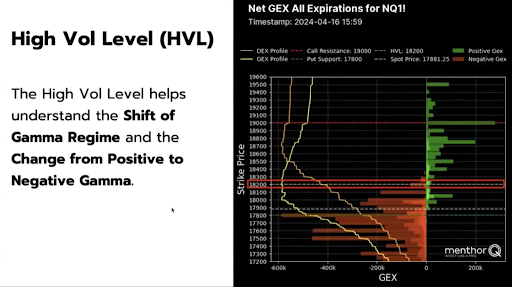
Chart showing trade setup from HVL-Zero-DTE to One Day Max with price projection pathway.
One Day Expected Move: Statistical Boundaries for Intraday Trading
MenthorQ’s One Day Min and Max levels provide statistically grounded price boundaries. These are calculated from forward-looking option volatility and have proven reliability:
- One Day Min holds 87 percent of the time
- One Day Max holds 85 percent of the time
Traders can use these levels for:
- Entry or exit timing
- Placing directional bets at extremes
- Selling premium outside of expected move
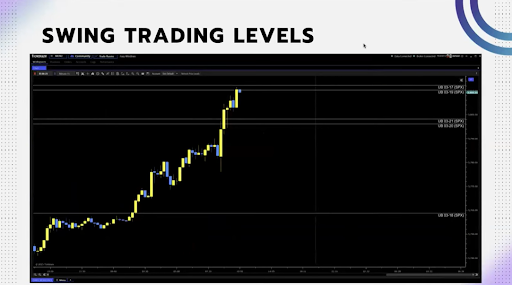
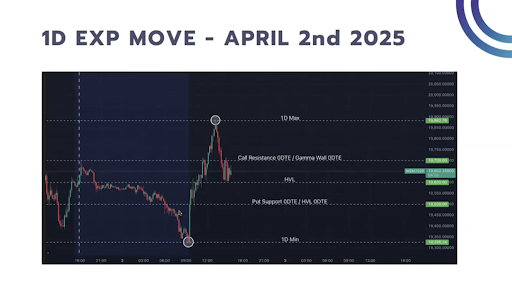 Tickblaze screen showing One Day Min and Max plotted on intraday chart with price reversal at boundary.
Blind Spots: Cross-Asset Liquidity Zones
Blind Spots are zones of overlapping gamma levels across correlated assets. For example, if Tesla, Nvidia, QQQ, and ES all share a gamma concentration at the same level, that area becomes a price magnet.
Instead of analyzing multiple charts, traders can focus on these converging levels and anticipate high-volume reactions. This tool is unique to MenthorQ and built from observed patterns in institutional positioning.
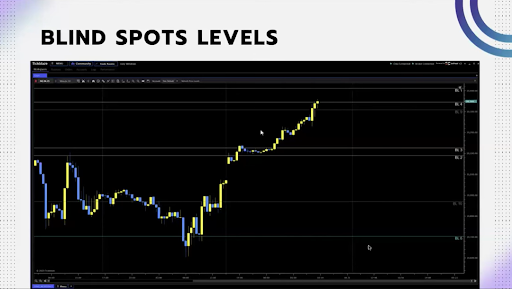
Consolidated gamma chart showing blind spot zone across four correlated assets with price clustering.
Swing Forecast Models: 5-Day and 20-Day Projections
MenthorQ provides forward-looking models for price boundaries over weekly and monthly periods, based on volatility and options flow. Traders can use these for:
- Holding directional swing positions
- Selling options outside expected range
- Managing risk and confidence
 MenthorQ swing model forecast panel showing projected upper and lower bands
The Q Score: Market Sentiment in One Number
The Q Score is MenthorQ’s composite indicator of market sentiment, combining:
- Options activity
- Volatility
- Momentum
- 20-year seasonality
It offers a 0 to 5 score, with an additional –5 to +5 for seasonality. A declining Q Score can be a leading indicator of institutional repositioning or broader market weakness.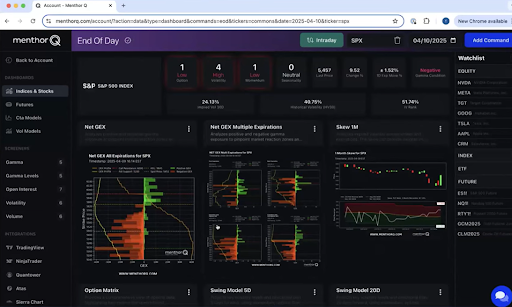
MenthorQ dashboard displaying Q Score and seasonal bias across major asset classes.
Morning Routine for Objective Trading
MenthorQ’s recommended routine takes two to five minutes and includes:
- Monitor key tickers
- Check Q Score
- Review gamma exposure
- Analyze 0-DTE flows
- Evaluate skew
- Confirm swing model bias
- Draw levels on charts
This process strips emotion from the trading day, providing a structured start based on institutional behavior.
Real-Time Execution with Tickblaze Integration
All MenthorQ indicators are now fully embedded in Tickblaze. Levels auto-refresh, can be customized per instrument, and are used directly within trade execution windows.
Traders can set alerts, view dynamic gamma shifts, and execute trades in real time based on intraday level reactions. This bridges the gap between analysis and action.
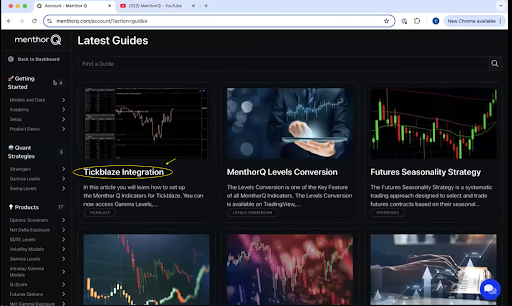 MenthorQ has Tickblaze integration ready to go
MenthorQ Pro Group: Structured, Team-Based Trading
Membership includes:
- 20+ hours of live coaching per week
- Monday Power Hour, daily live trading, Friday capital preservation sessions
- Community-style trading with shared setups and open discussion
MenthorQ emphasized the importance of a trading desk mentality, where traders share observations and build skills together, rather than operating in isolation.
Final Thoughts
This integration delivers a true professional-grade upgrade to the retail trading workflow. It’s not about more indicators—it’s about visibility into market structure, sentiment, and positioning that drives price.
MenthorQ provides the data. Tickblaze brings the execution. Together, they eliminate the guesswork and arm traders with the information they need to act with clarity.
If you’ve ever wanted to trade like the institutions, this is where it begins.
DISCLAIMER
NeuroStreet (and all corporate and/or subsidiary brands) has no financial interest in the outcome of any trades mentioned herein. There is a substantial risk of loss when trading securities. You are solely responsible for all decisions regarding purchase or sale of securities (futures, forex, stocks, options, crypto), suitability, and your own risk tolerance. Choosing to engage in any of the products or services demonstrated presumes you have fully read and understood the risk involved in trading as set forth herein. There may be tax consequences for short-term profits or losses on trades. Consult your tax professional or advisor for details on these if applicable. Neither NeuroStreet (and all corporate and/or subsidiary brands), nor its principles, contractors or employees are licensed brokers or advisors.
NeuroStreet (and all corporate and/or subsidiary brands) offers services and products for educational purposes only. Market recommendations are not to be construed as investment or trading advice. You acknowledge that you enter into any transactions relying solely on your own judgment. Any market recommendations provided are generic only and may or may not be consistent with the market positions or intentions of NeuroStreet (and all corporate and/or subsidiary brands) or its affiliates. Any opinions, news, research, analysis, prices, or other information contained on our website or by presentation of our material is provided as general market commentary, and do not constitute advisory services.
All testimonials provided are the personal experiences of individual users and are not representative, nor do they constitute any guarantees or expectation of future performance. Results are not typical and have not been verified. All testimonials are to be considered for informational purposes only and should not be construed as investment or trading advice.
CFTC RULE 4.41 – Hypothetical performance results have many inherent limitations, some of which are described below. No representation is being made that any account will or is likely to achieve profits or losses similar to those shown. In fact, there are frequently sharp differences between hypothetical performance results and the actual results subsequently achieved by any particular trading program. One of the limitations of hypothetical performance results is that they are generally prepared with the benefit of hindsight. In addition, hypothetical trading does not involve financial risk, and no hypothetical trading record can completely account for the impact of financial risk in actual trading. For example, the ability to withstand losses or to adhere to a particular trading program in spite of trading losses are material points which can also adversely affect actual trading results. There are numerous other factors related to the markets in general or to the implementation of any specific trading program which cannot be fully accounted for in the preparation of hypothetical performance results and all of which can adversely affect actual trading results.
NOT INVESTMENT OR TRADING ADVICE | INFORMATIONAL AND EDUCATIONAL PURPOSES ONLY
Author Note:
This article was written by an independent communications consultant engaged by NeuroStreet. The author is not a licensed financial advisor or broker and does not provide trading, investment, or financial advice. All information has been prepared using materials provided by the client and is intended solely for educational and informational purposes.