
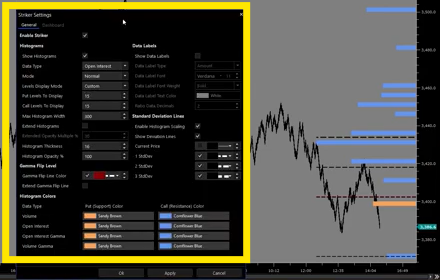
Striker Profiles, embedded natively within the Tickblaze trading platform, mark a seismic shift in access to institutional-grade options intelligence. Developed over a year by a team of platform engineers, data providers, and UI/UX specialists, Striker enables traders to see and act on the forces driving market structure—without coding, chain-reading, or guesswork.
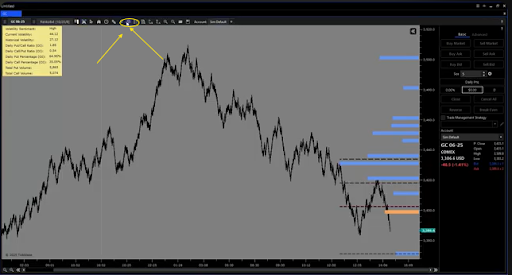
The Striker activation inside the Tickblaze toolbar.
Unlike overlays or third-party indicators, Striker Profiles live inside Tickblaze’s core infrastructure. When activated, they automatically analyze zero days to expiration (0DTE) options flow across:
- Stocks
- Futures
And they pinpoint:
- Institutional buying/selling zones
- Hedge pressure zones
- Volatility-driven reversal areas
Why Retail Traders Have Been Trading Blind
Retail tools such as VWAP, support and resistance lines, and Fibonacci retracements are inherently subjective. They rely on drawing or lagging patterns. Striker, in contrast, reveals intentional institutional behavior, backed by size, leverage, and options positioning.
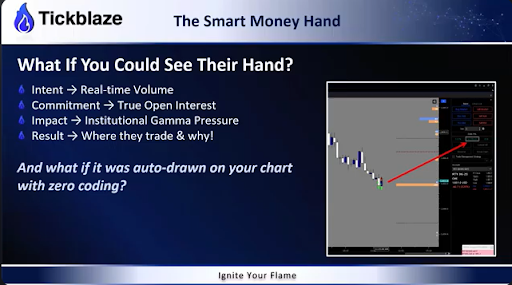 Institutions using options to control the market structure.
Institutions aren’t reacting to price. They’re shaping it—using options to hedge risk, control flow, and set traps for retail liquidity. Without that insight, you’re reacting to the effects, not reading the cause.
How Striker Profiles Automate Institutional Intelligence
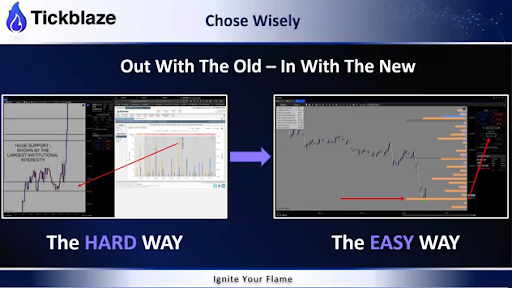 Contrast of manual process vs Striker’s automation.
Before Striker, manually interpreting took hours. It required scraping data from CME, running analytics, drawing levels, and interpreting institutional intent. Tickblaze’s creators automated it all.
Key components extracted and visualized include:
- Open Interest: Number of contracts held at a strike (a proxy for commitment)
- Gamma: Measures the rate of change of delta; helps identify zones of instability or control
- Gamma Volume: Executed volume near high gamma zones shows active positioning
- Volatility Skew: Measures imbalance in implied volatility between calls and puts, signaling directional bias
- Standard Deviations: Real-time probability zones (1st, 2nd, and 3rd deviations), defining expected range
Striker uses these metrics to color-code and auto-rank levels.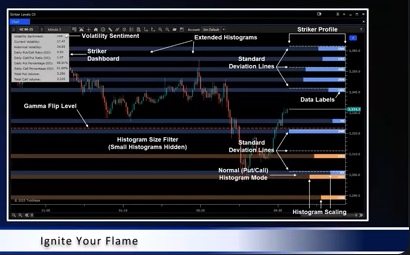
Show histogram scale and strength ranking system.
Zero DTE: The Institutional Blueprint for Intraday Moves
Institutions often dominate price action through 0DTE contracts. These instruments:
- Are extremely sensitive to price shifts
- Update quickly based on open interest and gamma changes
- Allow same-day institutional intent to be identified in real time
Striker only analyzes same-day expiring options because they represent the most urgent institutional moves. This creates a powerful framework for scalping, reversal trading, and momentum setups.
The Three Institutional Uses of Options—All Mapped in Striker
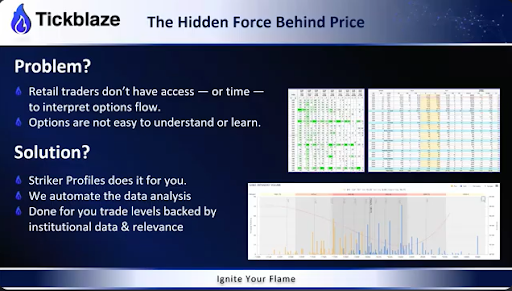 Problem and solution for what Striker brings to Tickblaze users
- Leverage – Institutions use options to place size without shifting markets.
- Hedging – Protect large exposures by creating price “buffers.”
- Directional Bets – Deliberate movement from level to level for profit.
Striker shows where these activities are taking place—and ranks each zone accordingly.
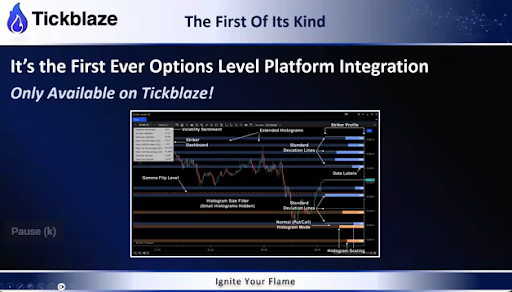
Understanding Striker’s Dashboard & Data Layers
 Striker set up
Each chart includes:
- Gamma Flip Line: The exact point where puts outweigh calls or vice versa—marking a directional shift.
- Stacked View: Colored histograms show institutional preference (blue = resistance/puts, orange = support/calls).
- Sentiment Box: Displays whether sentiment is bullish or bearish based on open interest skew and volume.
- Volatility Flag: High, medium, or low based on current IV vs historical norms.
When to Use Each Tool: Time-Based Deployment
Market Phase Striker Component Most Useful
Pre-Market Standard deviation zones, OI maps
Market Open (first 30 min) Gamma flips, stacked puts/calls
Mid-Day Consolidation Sentiment box, volume shifts
Close (last hour) Updated gamma, intraday skew
Use With Any Strategy—But Don’t Trade Without It
Striker Profiles work alongside:
- Volume Profile
- Market Profile
- Supply & Demand
- VWAP
- Trendlines / Reversal setups
- Order Flow Tools
- The One and Done Strategy
It adds context, bias, and execution precision to any framework. But without it, you’re trading uninformed.
Built Into Tickblaze, Not Available Elsewhere
 Offer only inside Tickblaze
Striker is not a plug-in. It’s embedded into Tickblaze’s native architecture:
- Activated via toolbar
- Options data feed included (covered by Tickblaze)
- Works across multiple data feeds
The Bottom Line: From Retail Noise to Institutional Clarity
Striker Profiles let you:
- Trade where the institutions are active
- Identify their intent, size, and pressure zones
- Use a 99.8% probability framework (based on standard deviations)
- Plan entries, exits, and targets with logic—not hope
Price respecting institutional boundaries to the tick.
Without Striker:
- You’re drawing arbitrary lines.
- You’re trading surface-level volume.
- You’re not seeing what causes price to move.
With Striker:
- You have access to institutional-level positioning.
- You know where price is likely to react—and why.
- You move from guessing to precision.
Ready to Trade Like an Insider?
Activate Striker inside Tickblaze today and:
- Trade with intent
- Avoid low-probability zones
- Let the data lead the way
“Don’t just analyze the market. Trade like you’ve seen the playbook.”
Watch the tutorial here.
DISCLAIMER
NeuroStreet (and all corporate and/or subsidiary brands) has no financial interest in the outcome of any trades mentioned herein. There is a substantial risk of loss when trading securities. You are solely responsible for all decisions regarding purchase or sale of securities (futures, forex, stocks, options, crypto), suitability, and your own risk tolerance. Choosing to engage in any of the products or services demonstrated presumes you have fully read and understood the risk involved in trading as set forth herein. There may be tax consequences for short-term profits or losses on trades. Consult your tax professional or advisor for details on these if applicable. Neither NeuroStreet (and all corporate and/or subsidiary brands), nor its principles, contractors or employees are licensed brokers or advisors.
NeuroStreet (and all corporate and/or subsidiary brands) offers services and products for educational purposes only. Market recommendations are not to be construed as investment or trading advice. You acknowledge that you enter into any transactions relying solely on your own judgment. Any market recommendations provided are generic only and may or may not be consistent with the market positions or intentions of NeuroStreet (and all corporate and/or subsidiary brands) or its affiliates. Any opinions, news, research, analysis, prices, or other information contained on our website or by presentation of our material is provided as general market commentary, and do not constitute advisory services.
All testimonials provided are the personal experiences of individual users and are not representative, nor do they constitute any guarantees or expectation of future performance. Results are not typical and have not been verified. All testimonials are to be considered for informational purposes only and should not be construed as investment or trading advice.
CFTC RULE 4.41 – Hypothetical performance results have many inherent limitations, some of which are described below. No representation is being made that any account will or is likely to achieve profits or losses similar to those shown. In fact, there are frequently sharp differences between hypothetical performance results and the actual results subsequently achieved by any particular trading program. One of the limitations of hypothetical performance results is that they are generally prepared with the benefit of hindsight. In addition, hypothetical trading does not involve financial risk, and no hypothetical trading record can completely account for the impact of financial risk in actual trading. For example, the ability to withstand losses or to adhere to a particular trading program in spite of trading losses are material points which can also adversely affect actual trading results. There are numerous other factors related to the markets in general or to the implementation of any specific trading program which cannot be fully accounted for in the preparation of hypothetical performance results and all of which can adversely affect actual trading results.
NOT INVESTMENT OR TRADING ADVICE | INFORMATIONAL AND EDUCATIONAL PURPOSES ONLY
Author Note:
This article was written by an independent communications consultant engaged by NeuroStreet. The author is not a licensed financial advisor or broker and does not provide trading, investment, or financial advice. All information has been prepared using materials provided by the client and is intended solely for educational and informational purposes.