
Unlocking Market Insights with Manual Profiling
Trading successfully requires more than spotting price movements—it demands understanding market structure, liquidity, and volume distribution. One of the most effective tools for this is manual profiling, a feature in the Tickblaze platform that allows traders to customize and analyze volume profiles at any location on a price chart.
This guide will walk you through leveraging manual profiling for identifying and executing high-probability trades, particularly during big market moves (capitulations). We’ll explore customization, strategic applications, and a step-by-step trade setup to optimize your trading edge.
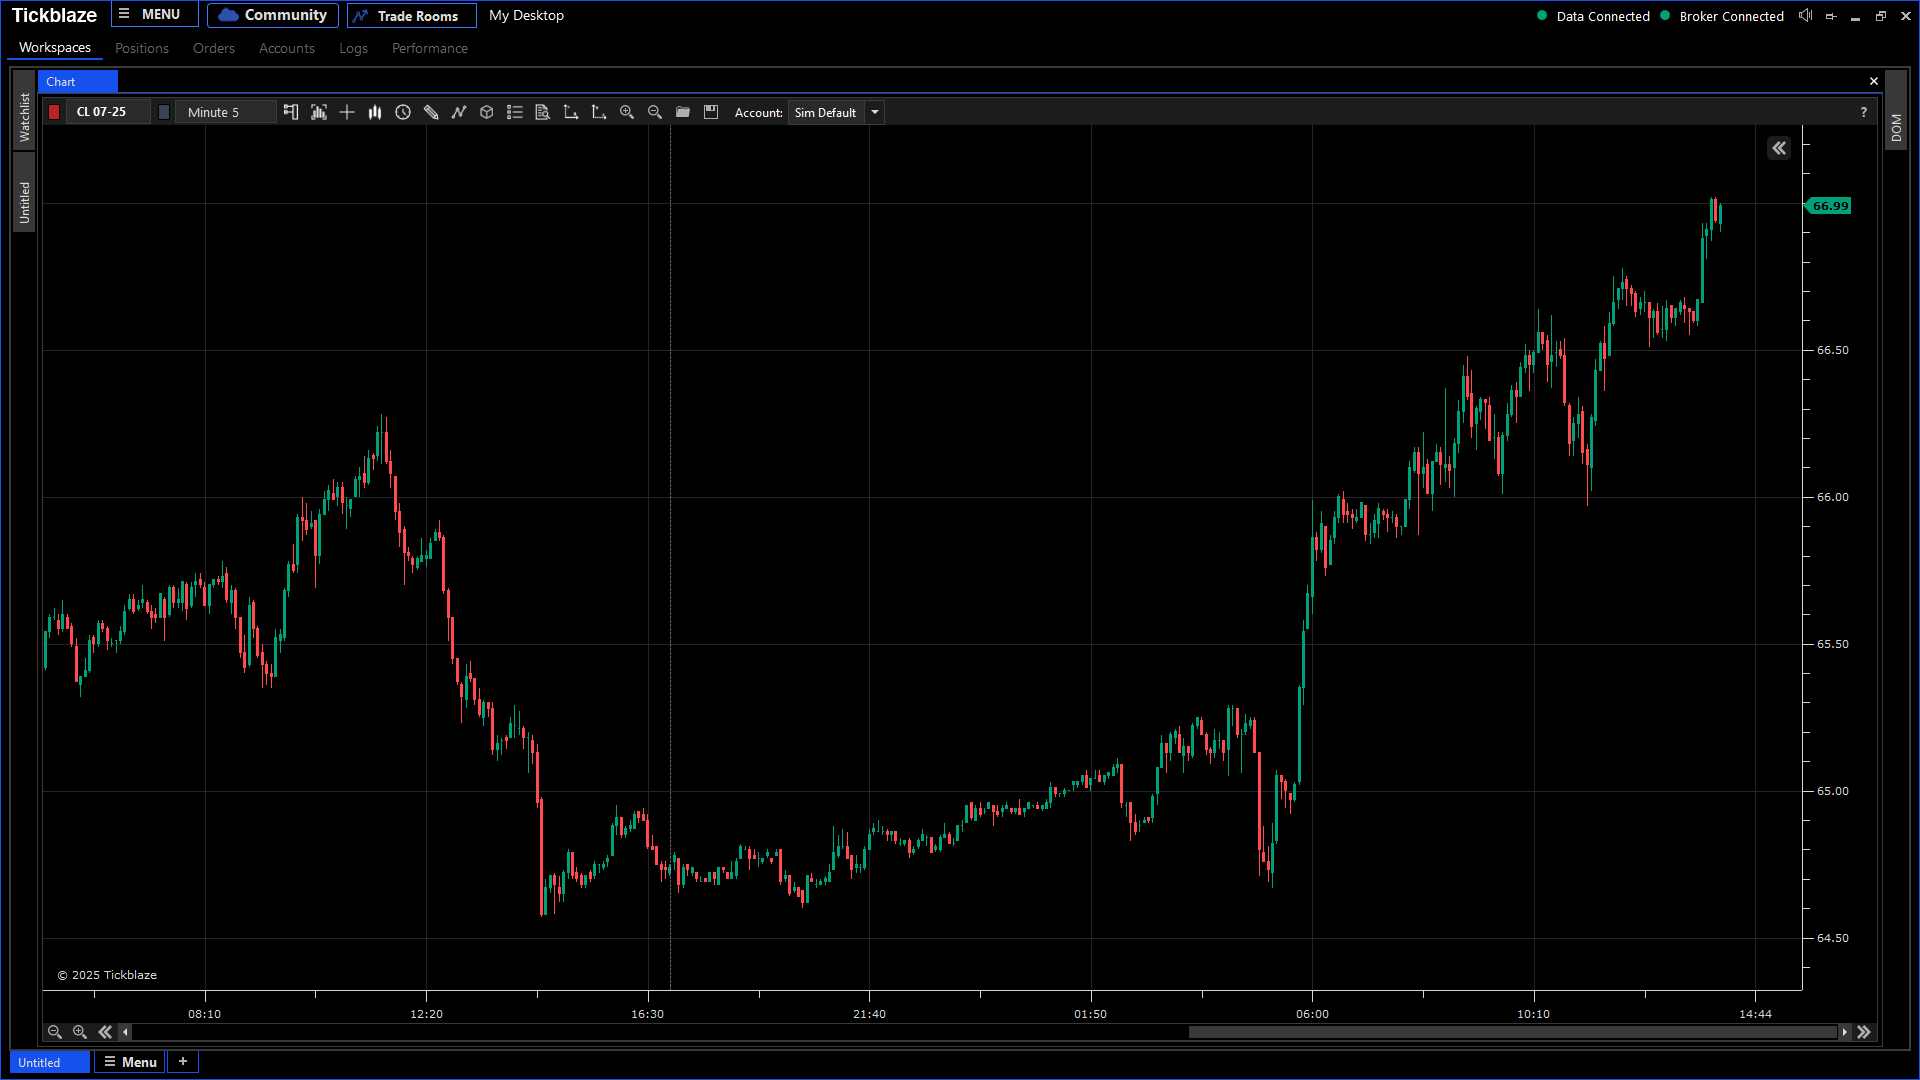 Selecting the manual profiling tool in Tickblaze.
What Is Manual Profiling?
Understanding the Basics
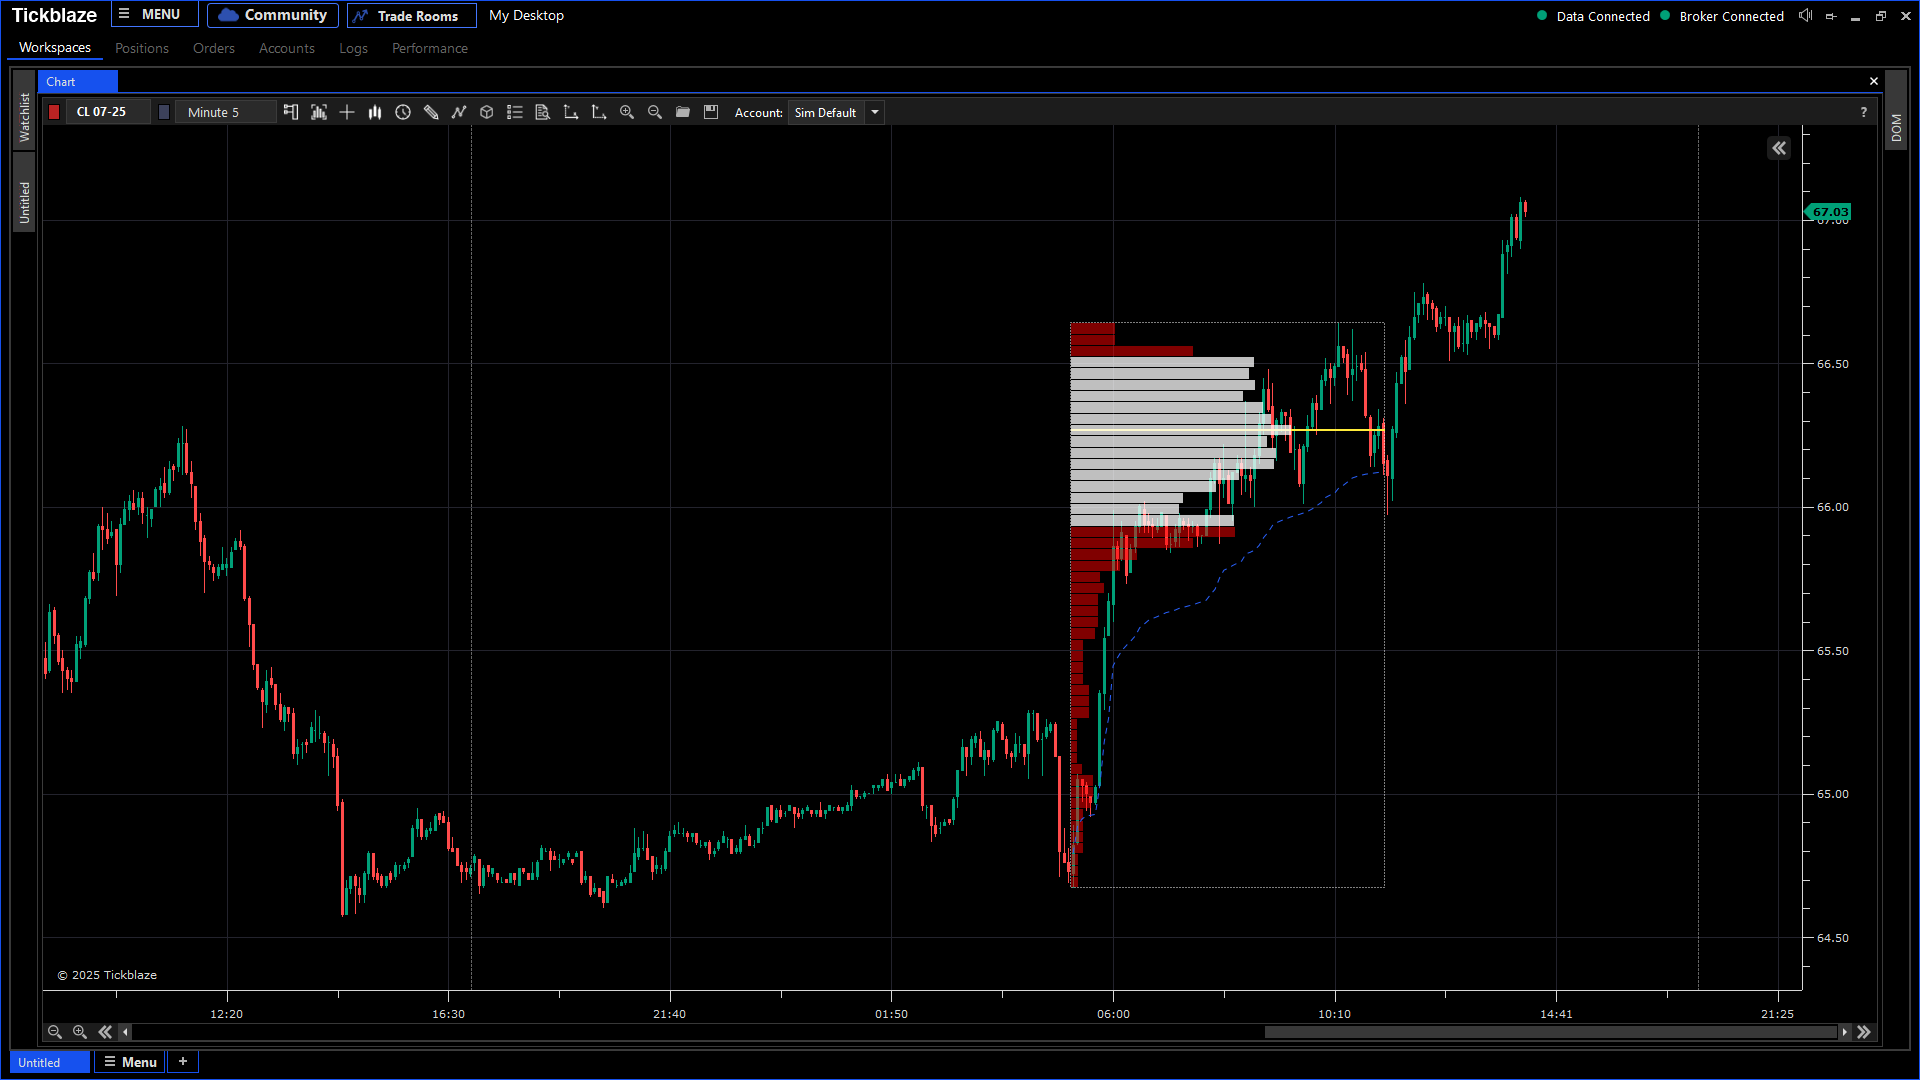
Manual profiling is a custom drawing tool that allows traders to draw volume profiles at any location on a chart to analyze price action, liquidity, and market dynamics. Unlike fixed volume profiles, this tool offers full flexibility, making it ideal for identifying key market turning points.
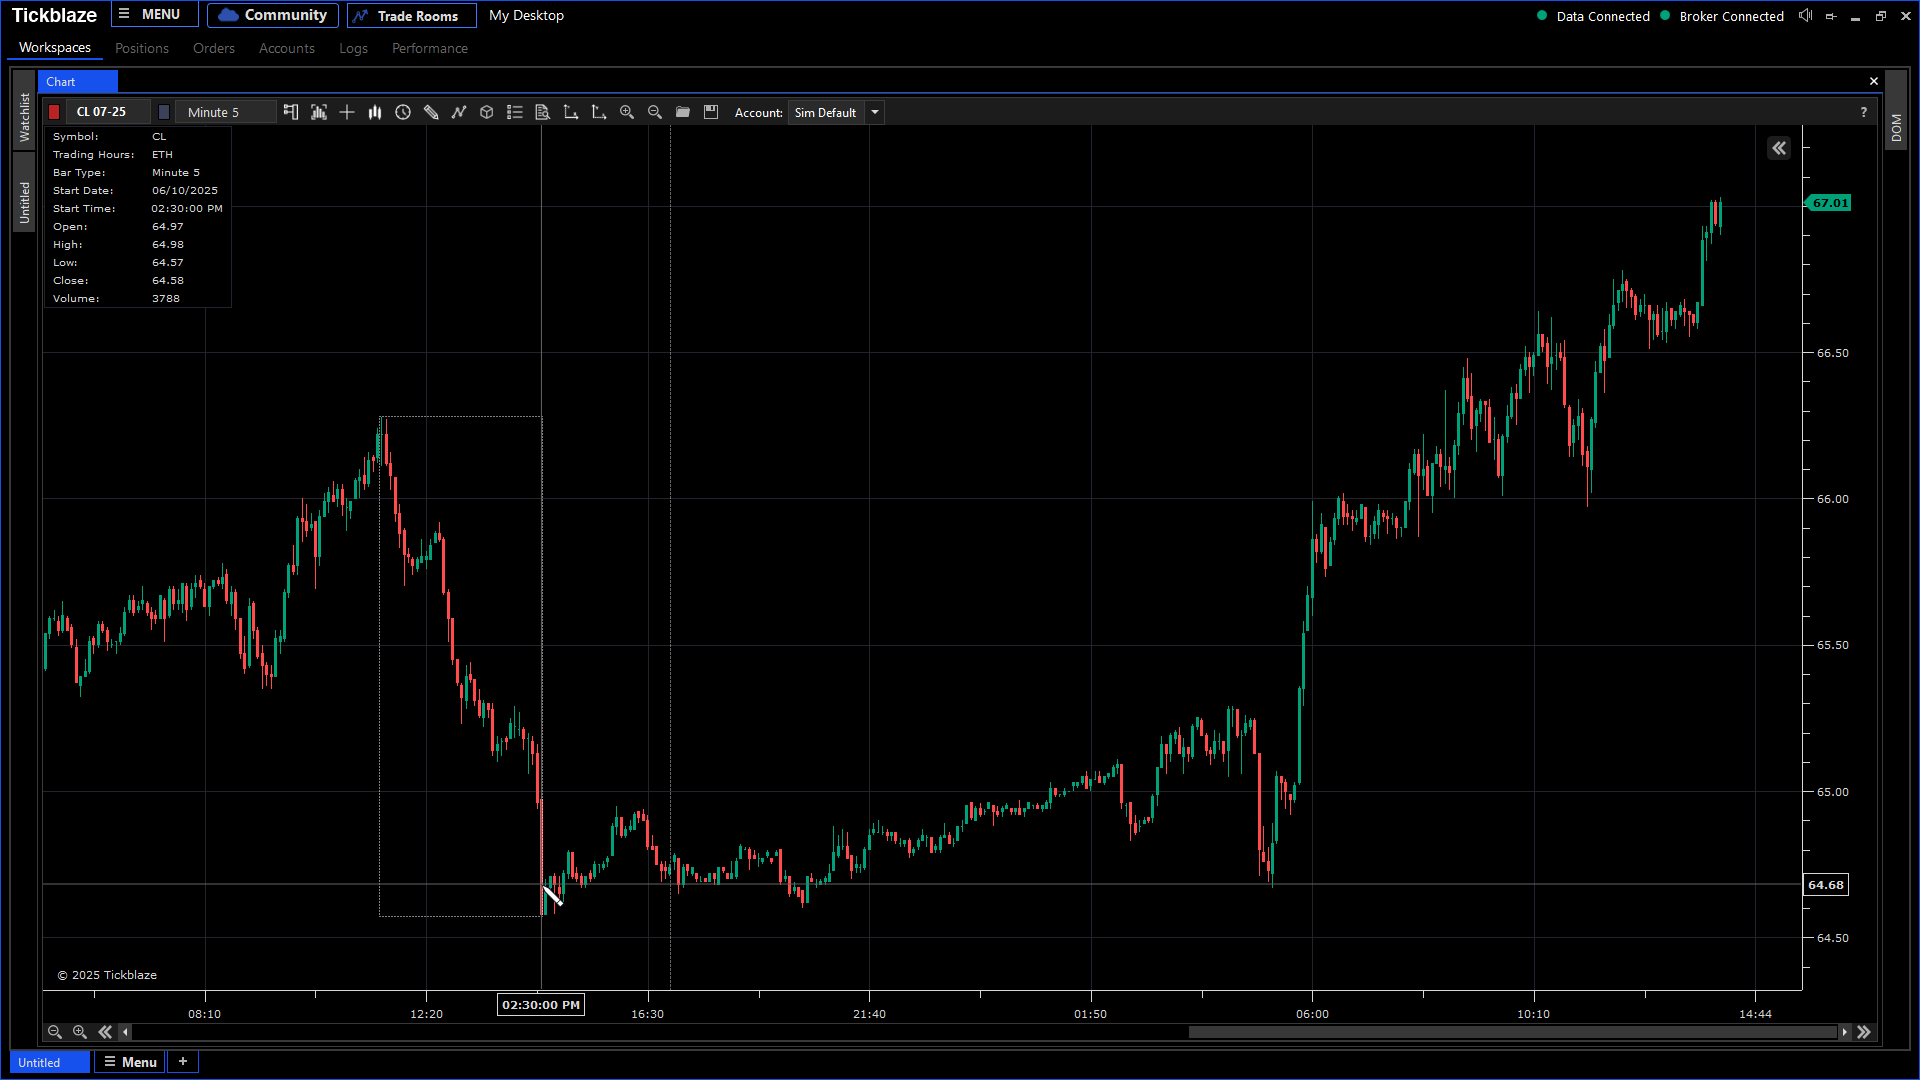 Example of drawing a manual volume profile on a Tickblaze chart.
Why It’s Useful
- Pinpoints high-volume areas (support/resistance zones).
- Highlights liquidity zones where institutional traders operate.
- Fully customizable—move, resize, and adjust the profile as needed.
- Supports multiple timeframes, making it useful for intraday and swing traders alike.
Optimizing Volume Profiles for Different Markets
Custom Settings & Adjustments
Manual profiling in Tickblaze allows traders to fine-tune their profiles for different markets and instruments:
Choose Data Source:
- Ticks → Best for intraday traders (granular insights).
- Seconds → Good for capturing short-term movements.
- Minutes → Suitable for broader trend analysis (e.g., 5-min or 15-min charts).
Adjusting profile settings in the Tickblaze platform.
Market-Specific Granularity:
- NASDAQ → Requires finer tick settings.
- S&P 500 → Has fewer ticks, allowing broader settings.
- Crypto & Stocks → Adjust settings based on volatility.
Styling & Customization:
- Color customization for easy identification of volume zones.
- VWAP integration for additional trade confirmation.
- Value Area High/Low markers to visualize support/resistance.
- Save templates for different assets (S&P, Bitcoin, Apple, etc.).
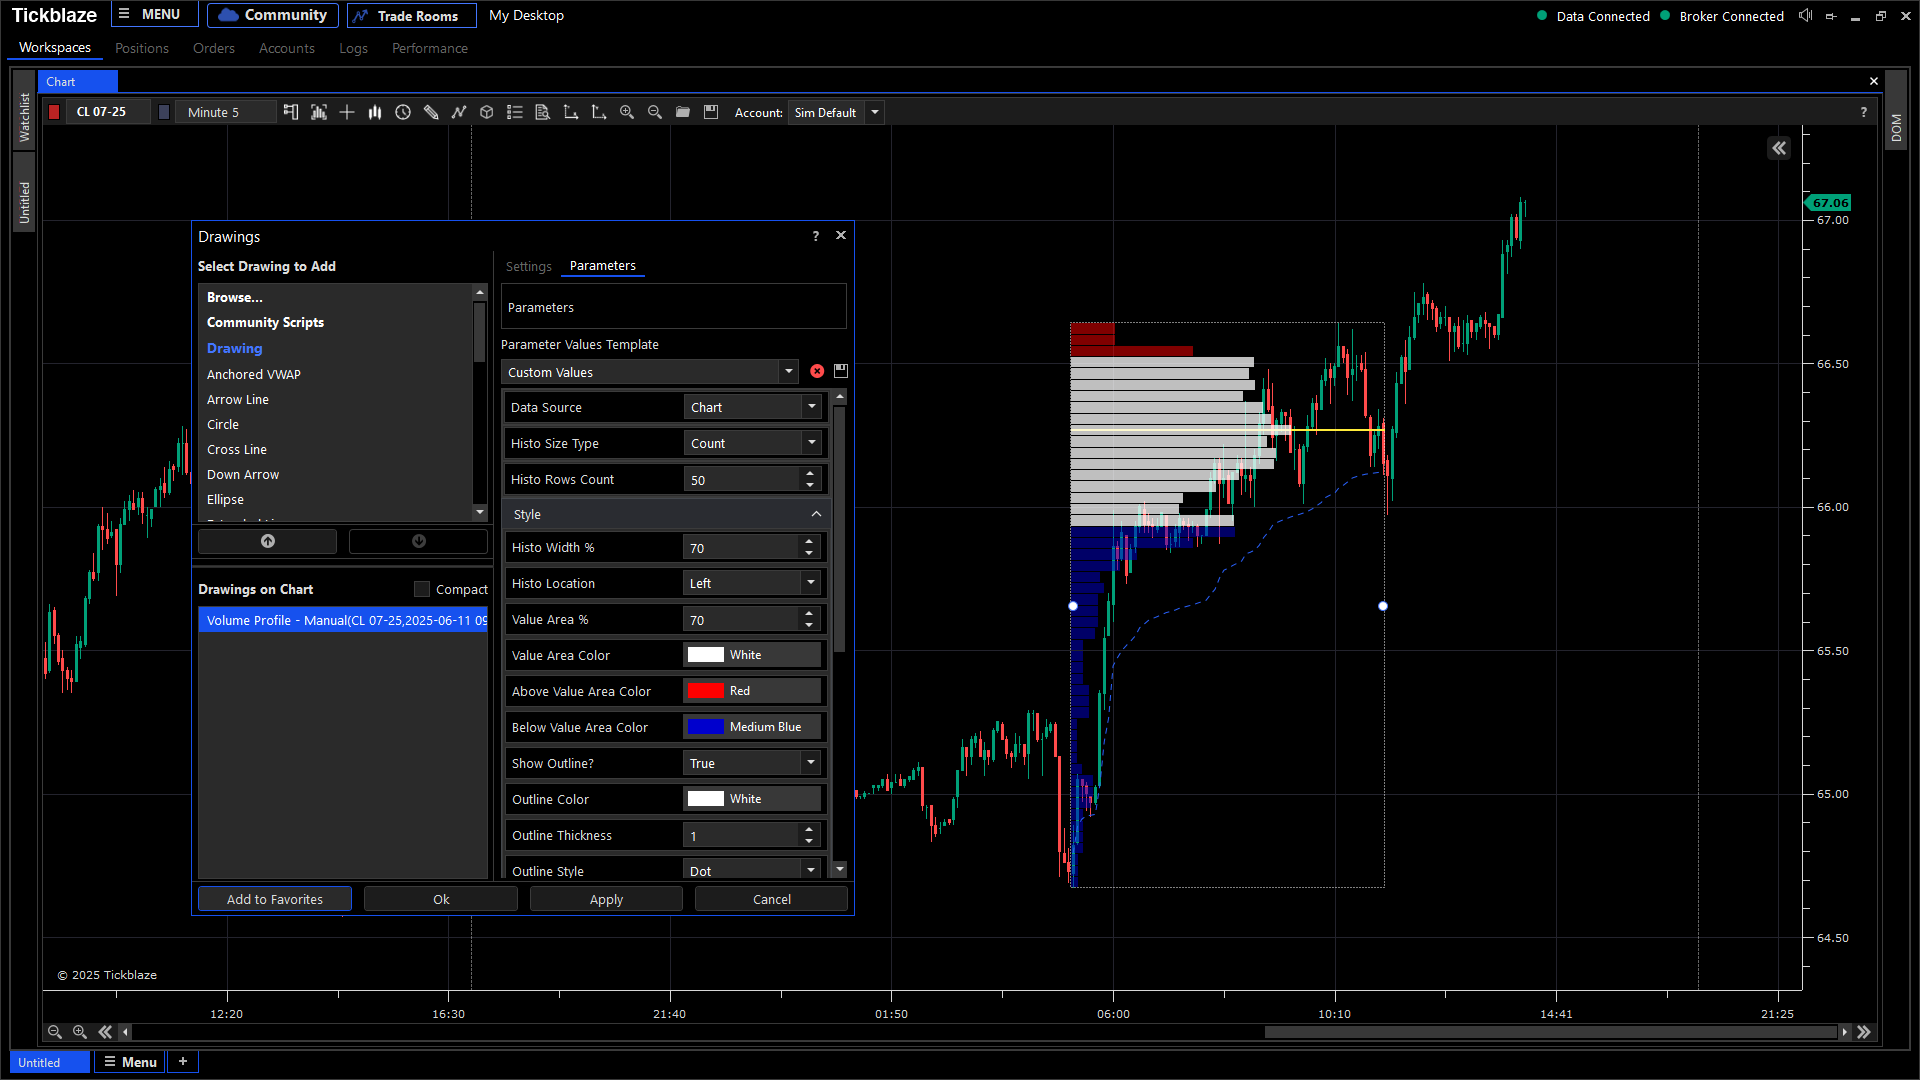
Setting up customized volume profile templates in Tickblaze.
Strategic Use of Manual Profiling: Trading Explosive Moves
A key advantage of manual profiling is its ability to capture major market moves (capitulations)—often triggered by high-impact news events like FOMC meetings, CPI releases, or interest rate decisions.
Understanding Market Auction Types
To effectively trade these moves, traders must understand three primary volume profile structures:
- D-Shaped Auction → Indicates range-bound markets; best for trading high/low breakouts.
- P-Shaped Auction → Forms after a strong upward move, signaling a long setup.
- B-Shaped Auction → Forms after a sharp downward move, signaling a short setup.
Visual representation of D, P, and B-shaped auctions.
Step-by-Step Guide to Trading Capitulation Moves
1. Identify the Explosive Move
- Look for a strong series of consecutive candles, not just a single bar.
- These moves often occur after fundamental events (e.g., CPI, FOMC, earnings reports).

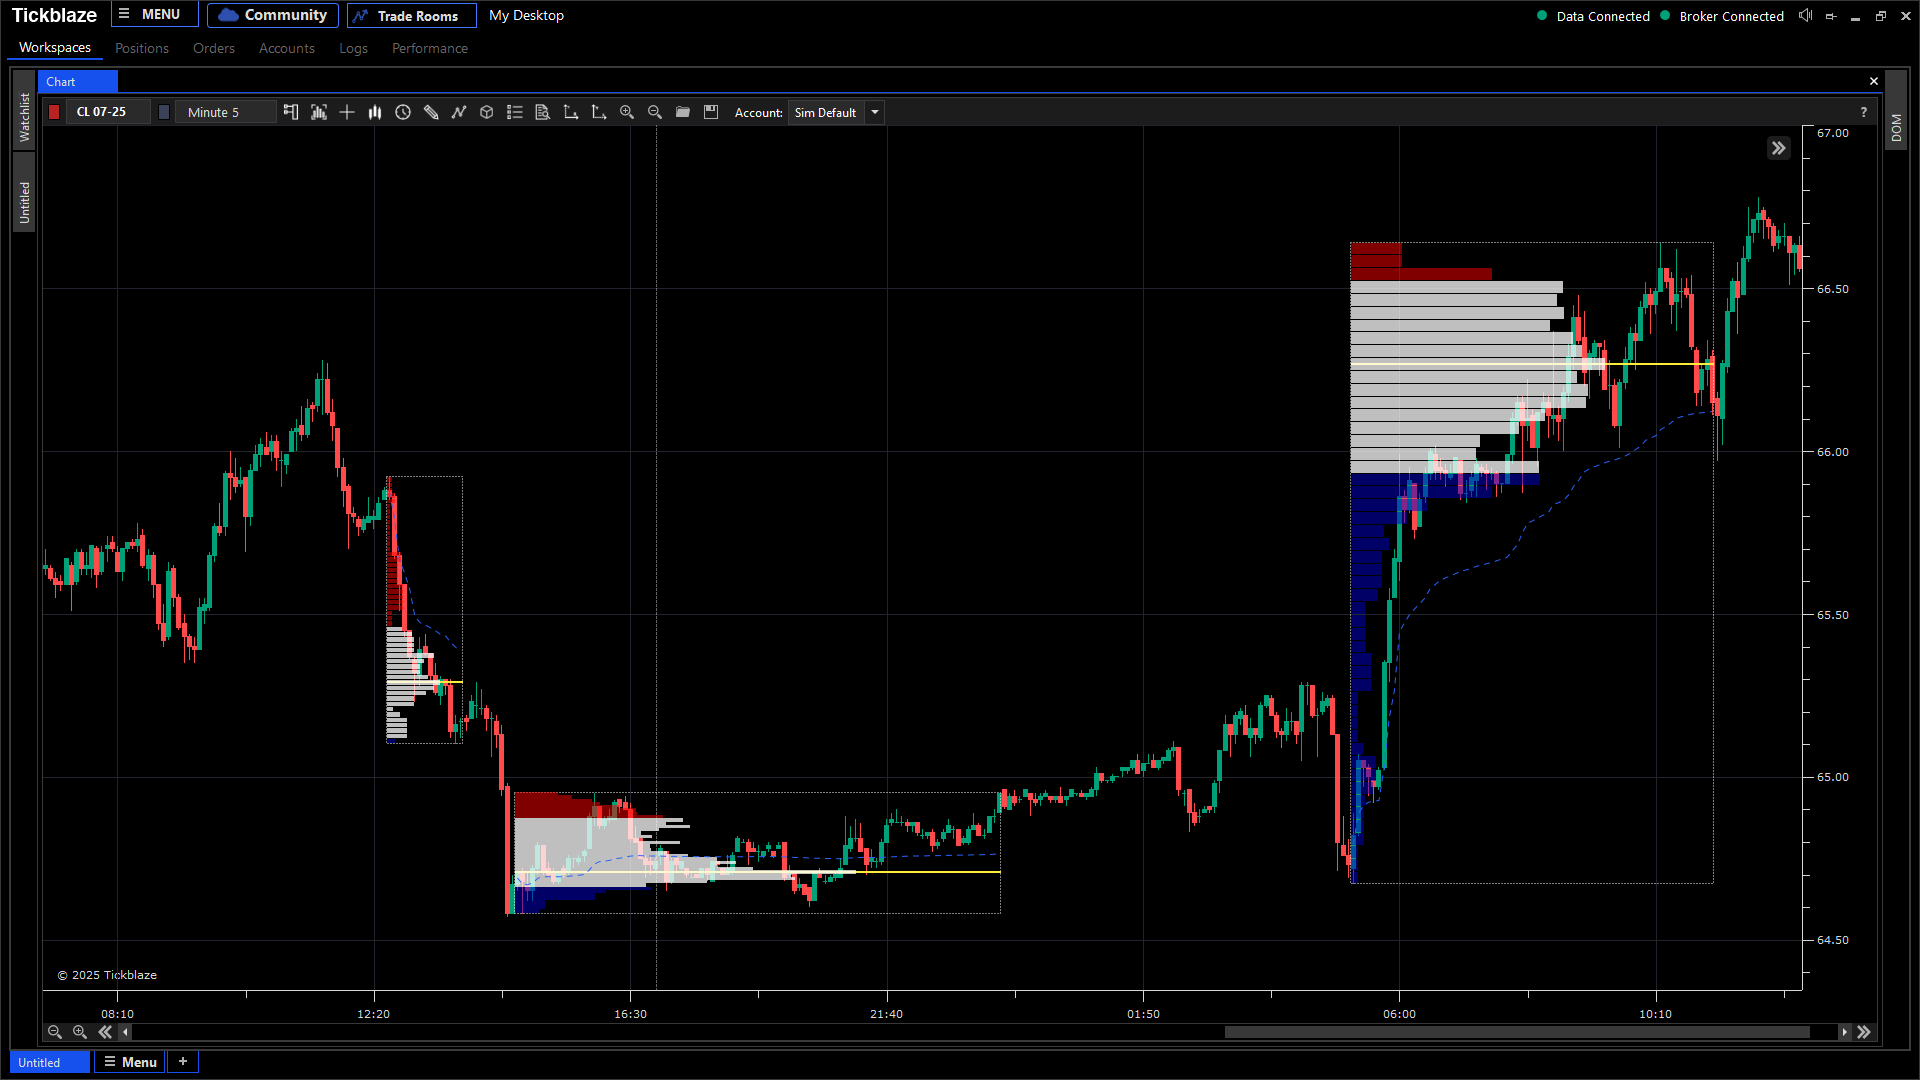
Example of an explosive market move forming a volume profile.
2. Locate the Last Consolidation Zone
- Markets typically consolidate before a major move.
- Identifying this area helps determine where large traders accumulated positions.
3. Find the Inducement Candle
- For downtrends: Identify the last up-bar before a sharp drop.
- For uptrends: Identify the last down-bar before a strong rally.
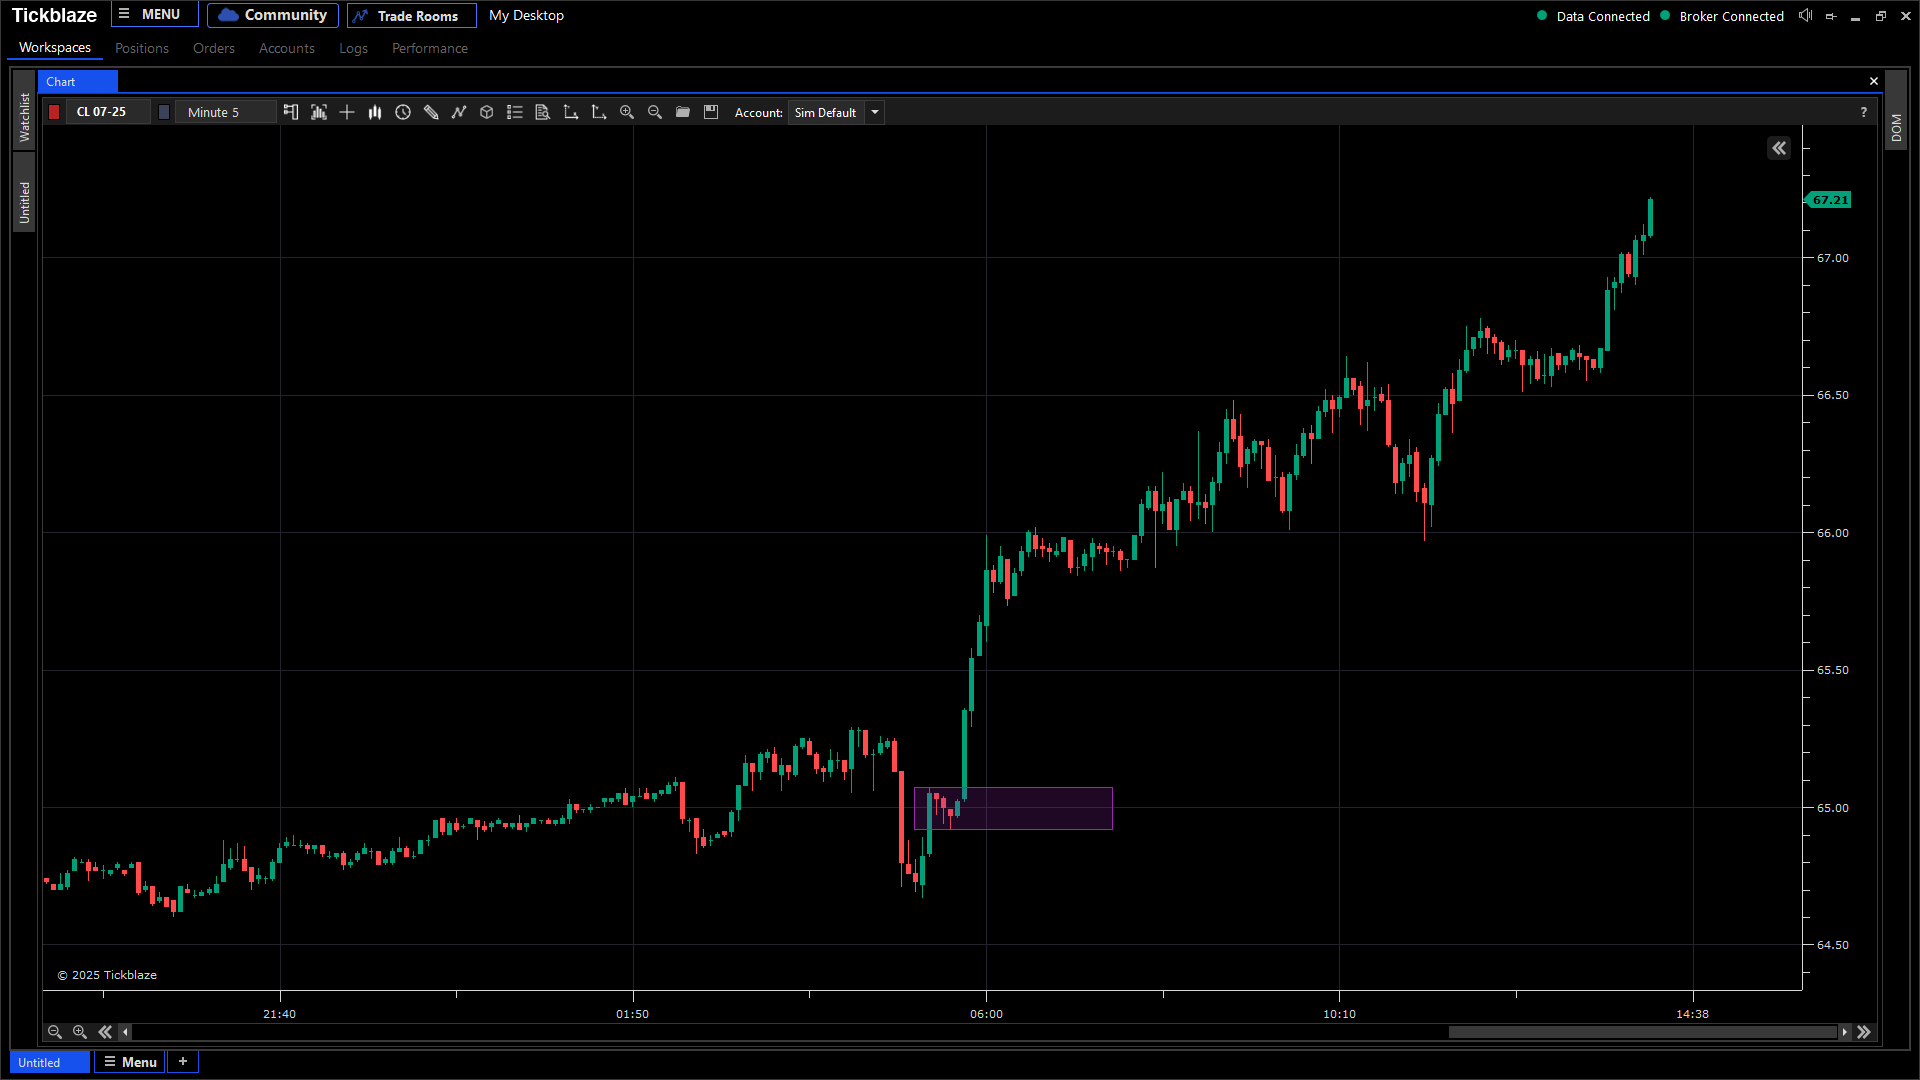
Selecting the inducement candle before a strong move.
4. Wait for the First Opposite Candle to Close
- This signals profit-taking, confirming that momentum is slowing down.
5. Draw the Manual Profile from the Inducement Candle
- Extend the profile from the last inducement candle to the first profit-taking candle.

Drawing a manual profile after identifying the key price action levels.
6. Execute the Trade
For B-shaped profiles (downtrends):
- Enter a short at the Value Area High.
- Target the Value Area Low for profit-taking.
For P-shaped profiles (uptrends):
- Enter a long at the Value Area Low.
- Target the Value Area High.
Example of a successful short trade based on a B-shaped profile.
7. Manage Risk & Reward
- Aim for a minimum 2:1 risk-to-reward ratio.
- Trades typically last 5–20 minutes, making them ideal for intraday traders.

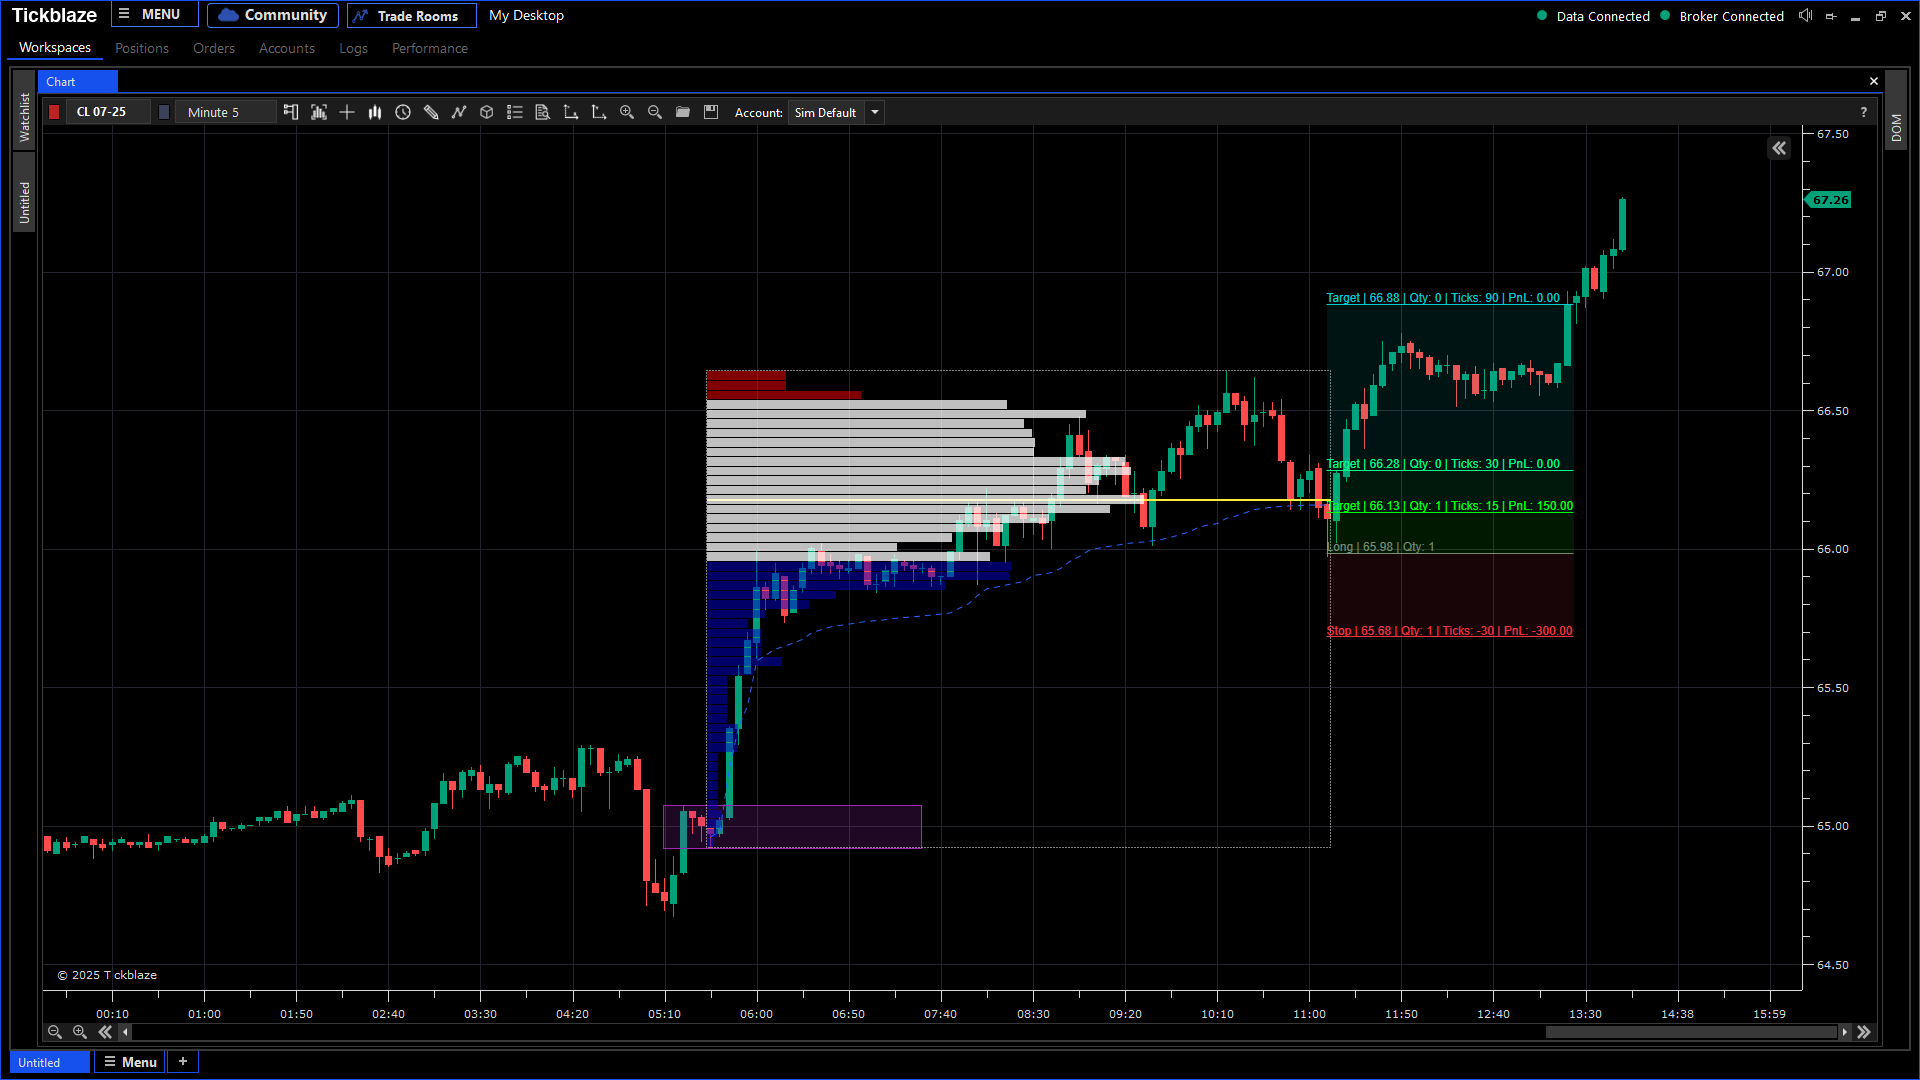
Trade entry and exit points based on volume profile analysis.
Key Takeaways & Final Recommendations
Watch the full video for visual learning:
Why This Strategy Works
- Captures institutional trading behavior post-news events.
- Leverages volume profile distributions to identify key price levels.
- Works across multiple markets (stocks, futures, forex, crypto).
How to Maximize Your Edge
- Trade on major news days (FOMC, CPI, earnings, etc.).
- Fine-tune profile settings for different markets.
- Wait for confirmation before executing trades.
- Manage risk effectively—always set stop losses.
- Backtest and refine execution for consistent performance.
Final Thoughts
Manual profiling in Tickblaze is a powerful tool for traders seeking deeper insights into market structure and volume distribution. By utilizing custom volume profiles to analyze D, P, and B-shaped auctions, traders can spot high-probability setups with precision and confidence.
By mastering this approach, traders can capitalize on high-impact market moves, allowing them to enter and exit trades strategically and profitably. Be sure to check out the Tickblaze Academy for more lessons.
DISCLAIMER
NeuroStreet (and all corporate and/or subsidiary brands) has no financial interest in the outcome of any trades mentioned herein. There is a substantial risk of loss when trading securities. You are solely responsible for all decisions regarding purchase or sale of securities (futures, forex, stocks, options, crypto), suitability, and your own risk tolerance. Choosing to engage in any of the products or services demonstrated presumes you have fully read and understood the risk involved in trading as set forth herein. There may be tax consequences for short-term profits or losses on trades. Consult your tax professional or advisor for details on these if applicable. Neither NeuroStreet (and all corporate and/or subsidiary brands), nor its principles, contractors or employees are licensed brokers or advisors.
NeuroStreet (and all corporate and/or subsidiary brands) offers services and products for educational purposes only. Market recommendations are not to be construed as investment or trading advice. You acknowledge that you enter into any transactions relying solely on your own judgment. Any market recommendations provided are generic only and may or may not be consistent with the market positions or intentions of NeuroStreet (and all corporate and/or subsidiary brands) or its affiliates. Any opinions, news, research, analysis, prices, or other information contained on our website or by presentation of our material is provided as general market commentary, and do not constitute advisory services.
All testimonials provided are the personal experiences of individual users and are not representative, nor do they constitute any guarantees or expectation of future performance. Results are not typical and have not been verified. All testimonials are to be considered for informational purposes only and should not be construed as investment or trading advice.
CFTC RULE 4.41 – Hypothetical performance results have many inherent limitations, some of which are described below. No representation is being made that any account will or is likely to achieve profits or losses similar to those shown. In fact, there are frequently sharp differences between hypothetical performance results and the actual results subsequently achieved by any particular trading program. One of the limitations of hypothetical performance results is that they are generally prepared with the benefit of hindsight. In addition, hypothetical trading does not involve financial risk, and no hypothetical trading record can completely account for the impact of financial risk in actual trading. For example, the ability to withstand losses or to adhere to a particular trading program in spite of trading losses are material points which can also adversely affect actual trading results. There are numerous other factors related to the markets in general or to the implementation of any specific trading program which cannot be fully accounted for in the preparation of hypothetical performance results and all of which can adversely affect actual trading results.
NOT INVESTMENT OR TRADING ADVICE | INFORMATIONAL AND EDUCATIONAL PURPOSES ONLY
Author Note:
This article was written by an independent communications consultant engaged by NeuroStreet. The author is not a licensed financial advisor or broker and does not provide trading, investment, or financial advice. All information has been prepared using materials provided by the client and is intended solely for educational and informational purposes.