


Whether you’re a beginner or a professional trader, a breakout trading strategy with support and resistance levels is one of the simplest and most effective. The only problem is, how do you identify the most effective support and resistance levels? This is where the double top and double bottom chart patterns trading strategy comes in.
Both double top and double bottom chart patterns allow you to draw support and resistance levels depending on the timeframe you’re trading. Despite their efficiency in determining the support and resistance levels, always combine double top and bottom with other trading strategies like VWAP analysis to avoid potential false breakouts.
The double top is a bearish reversal pattern, which means it often precedes a bullish to a bearish trend reversal. In this case, you can open a short position when the price breaks below the support level. On the other hand, the double bottom is a bullish reversal pattern that often precedes a bearish to bullish trend reversal. You can execute a long position when the price breaks above the resistance.
Let’s break them down.
What is the Double Top Chart Pattern?
A double top is a bearish reversal chart pattern usually formed in a bull run when the asset hits two highs with a slight pullback between them. The two tops usually form around the same price level when the price action hits a resistance level. Here’s what a typical double top chart pattern looks like.
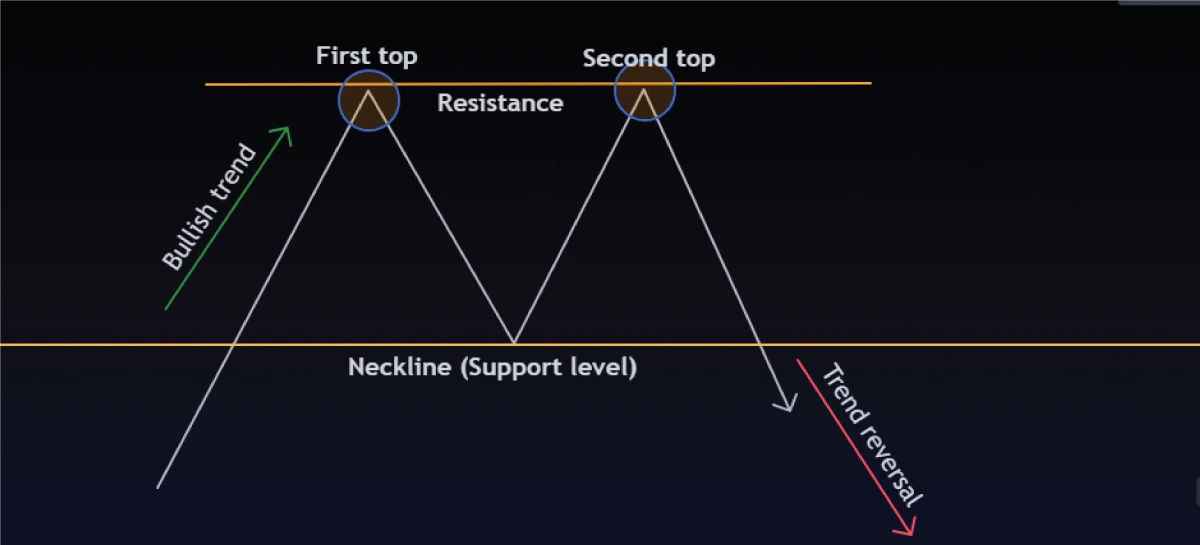
As a bearish reversal pattern, the formation of a double top implies that the current bullish momentum is weakening and a possible reversal is imminent. When trading the double top, you should ideally short the market below the neckline.
How to Identify Bearish Reversal with Double Top Pattern
Five simple steps are involved if you want to trade the double top bearish reversal.
Step 1: Identify an Existing Bullish Trend
The first step is to identify a current bullish trend. The trend has to be long-term depending on the timeframe you’re trading. This increases the possibility of its momentum waning.
Step 2: Spot the First Peak
The initial peak in this chart pattern often represents profit-taking by traders who were long. Here, buyers with increasing demand no longer dominate the market, and the price has reached its maximum.

Note that the build-up to this initial peak is primarily driven by increased volume traded.
Step 3: The Price Drops
Since most buyers are turning into sellers, the price drops slightly but significantly. Note that this drop is never a full-on pullback or reversal. Once the price starts rising, draw a horizontal line at the lowest price level reached.

This is the support level and will be crucial in confirming the complete formation of the double top pattern.
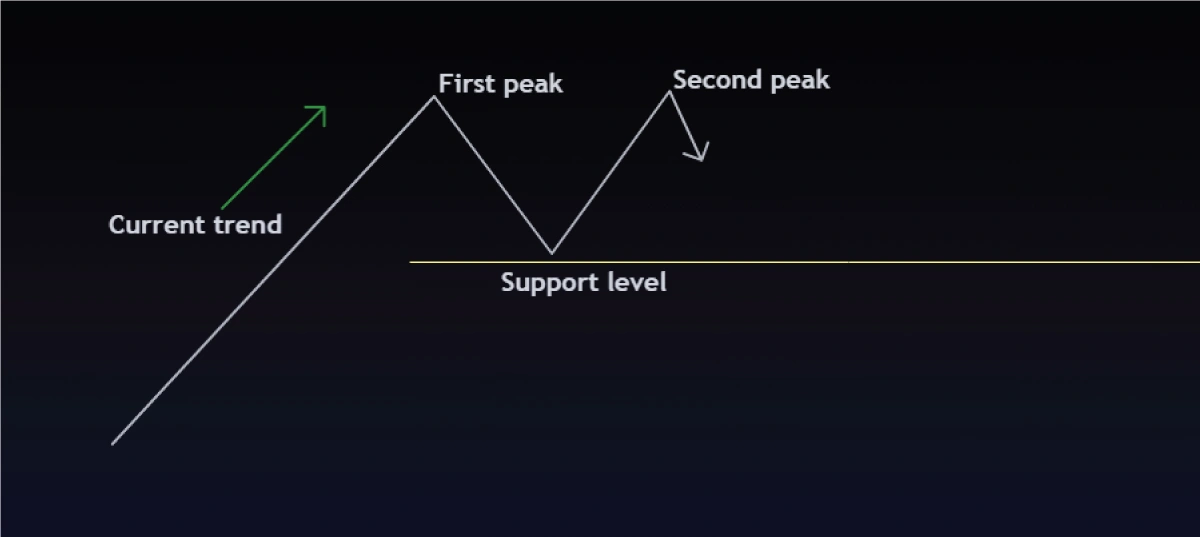
Step 4: The Second Peak
Once the rally begins from the support level you’ve just drawn, it will be short-lived and the prices won’t rise much higher than the first peak. Note that there’s usually a divergence between price and volume traded at this stage – although the price is rising, the volume traded could be dropping. This is a clear indicator of weak momentum and is a sign that the trend may not be sustainable and could reverse.
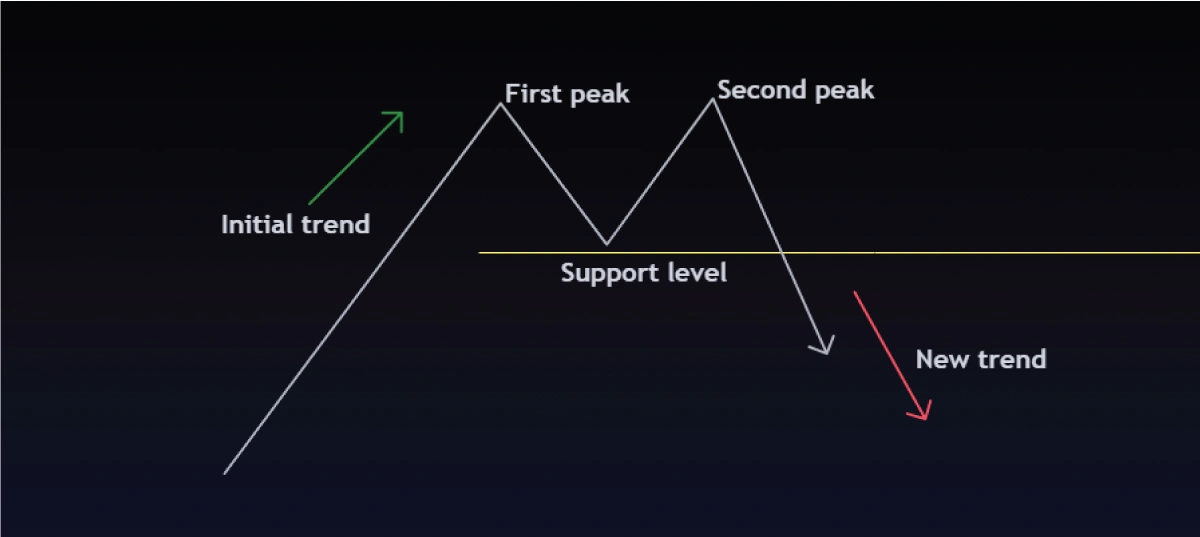
Step 5: Price Breaches the Support Level
There is a steady drop in the price action after the formation of the second top breaks below the support level. This usually confirms the double top chart pattern and could be interpreted as a confirmation of the bearish reversal. Generally, this breakout should be accompanied by increased volume.
How to Trade the Double Top Chart Pattern
Now that you know how to identify the double top chart pattern, executing a trade should be fairly straightforward.
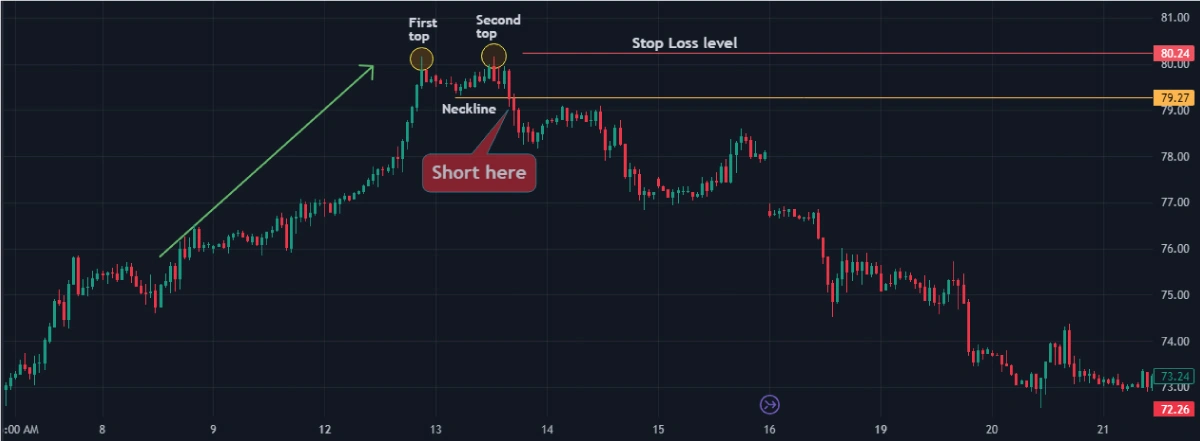
Since the double top is a bearish reversal pattern, your possible entry for a short position should be below the support level.
The stop loss level should be above the resistance level of either peak. The logic is that if the price rises again and breaches the resistance level, the double top pattern would have failed.
As for the profit target, you can use timeframe analysis to identify possible support levels under different timeframes. Alternatively, you can use the average true range (ATR) indicator to set your profit target based on the prevailing market volatility.
What is the Double Bottom Chart Pattern?
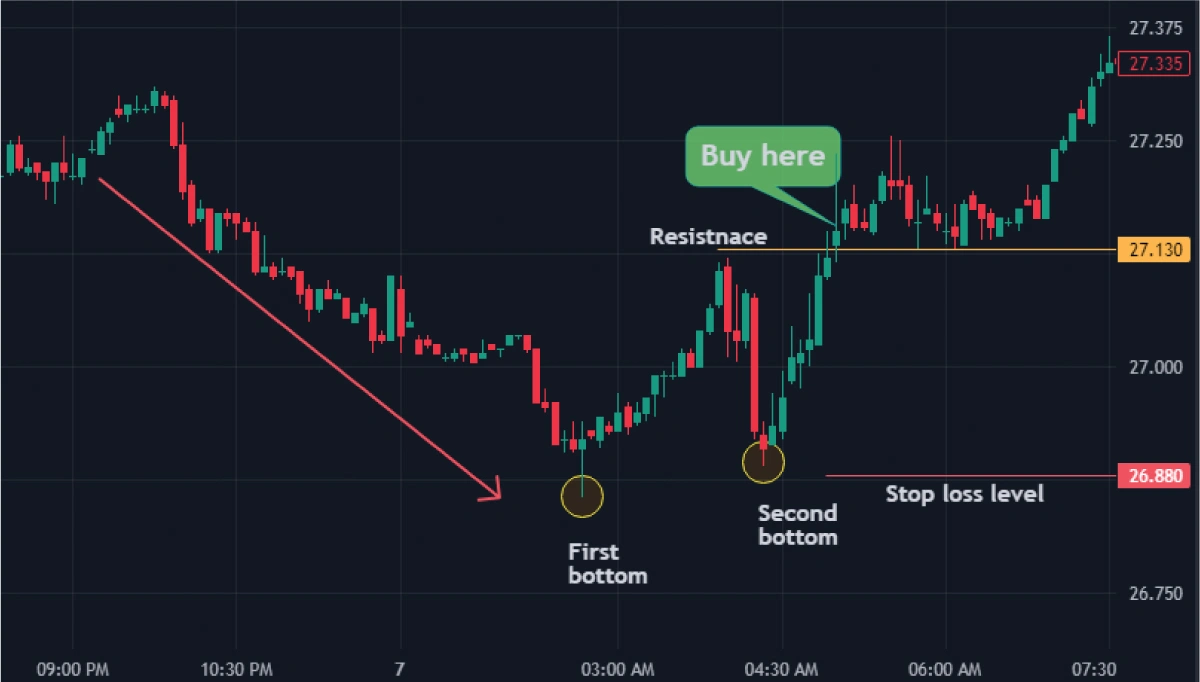
The double bottom pattern is the exact opposite of the double top chart pattern. It is a bullish reversal chart pattern that forms when a bearish trend is losing momentum. It’s characterized by two swing lows separated with a moderate uptrend in between, forming a W shape, as shown below.
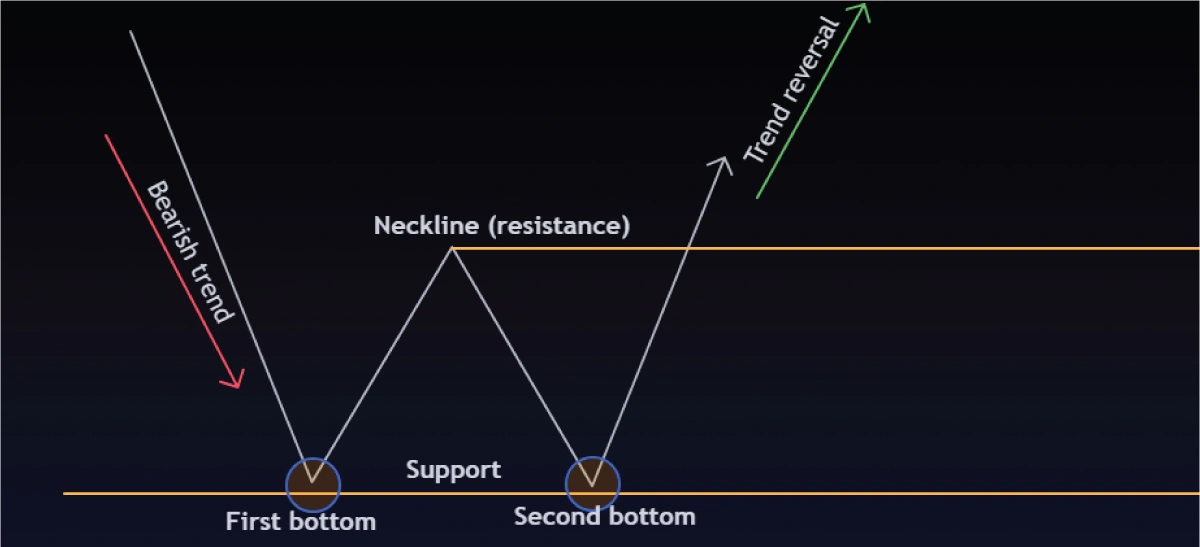
Since it’s a bullish reversal pattern, its formation signals that you should possibly exit short positions and look for long entries. Ideally, you should go long above the neckline (the resistance level).
How to Identify Bullish Reversal with Double Bottom Pattern
Here are the steps to identify a bullish reversal with the double bottom chart pattern.
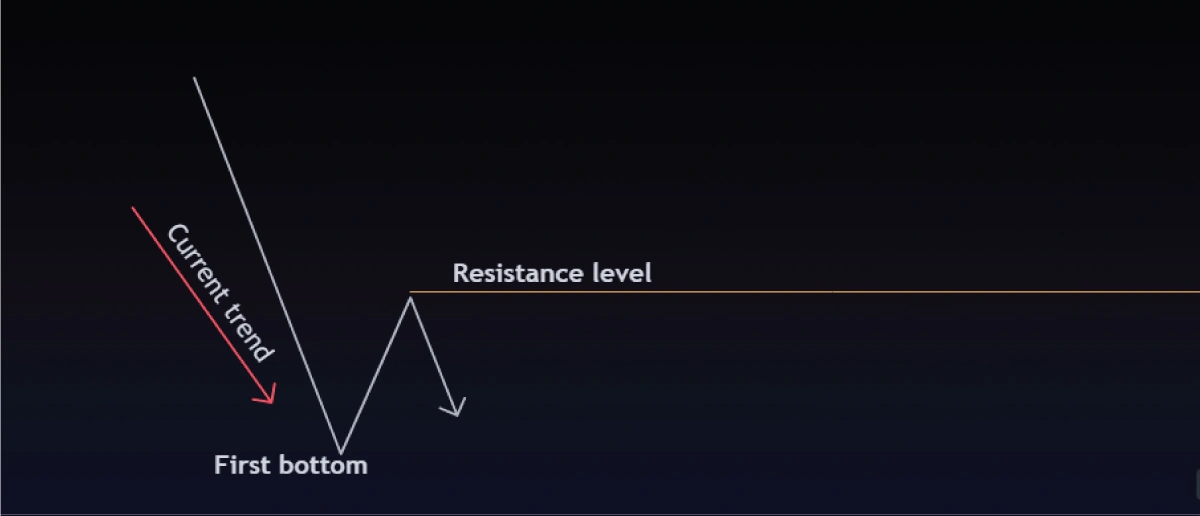
Step 1: Identify a Prevailing Bearish Trend
Your first step is to identify a long-term bearish trend. This will vary depending on the timeframe you’re trading. Note that the longer the trend has been running, the better the chances of the price bottoming out.
Step 2: Spot the First Bottom
This initial bottom will be the first swing low of the observed bear trend. It’s mainly a result of short sellers exiting the market – liquidating their short positions halts the trend’s momentum.

Generally, the trend to the first bottom is driven by higher short-selling volume. The first bottom directly results from a decrease in the volume traded by the short sellers.
Step 3: A Short-lived Price Rally
The price rises slightly after the first bottom. This rally doesn’t represent a full recovery; it’s only short-lived. The height of this rally is the short-term resistance and will be the trigger point for long positions.
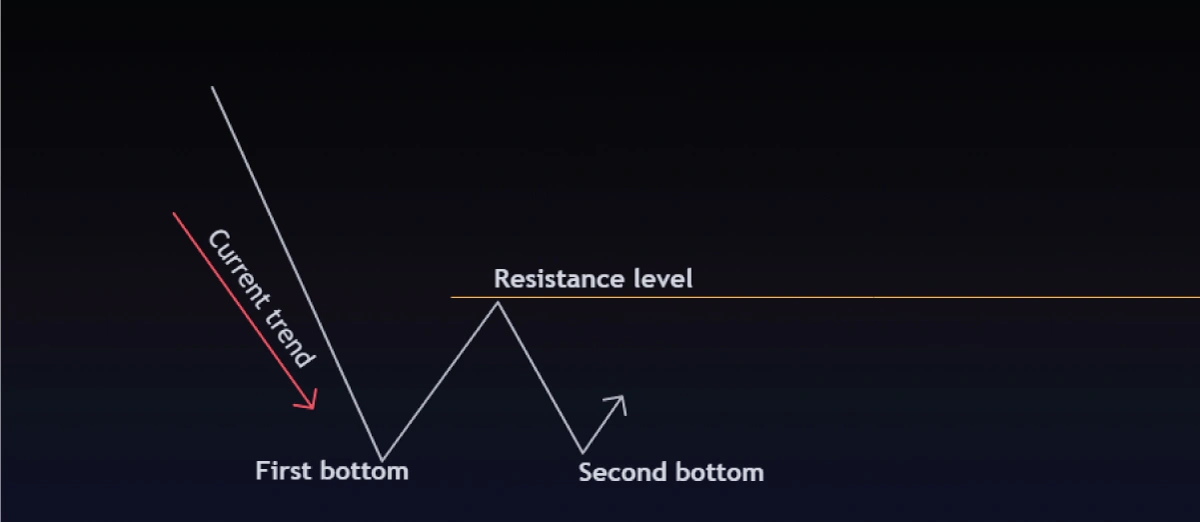
Step 4: The Second Bottom
The short-lived rally is punctuated by a subsequent drop in the price towards the level of the initial swing low. At this stage, there’s a divergence between the drop in price and volume traded, indicating that the selling momentum is weak and will eventually reverse.
Once the price reaches the initial swing low, it rises steadily toward the short-term resistance level drawn in ‘Step 3’ above. This completes the formation of the second bottom and is confirmation that sellers have failed to push the prices further down.
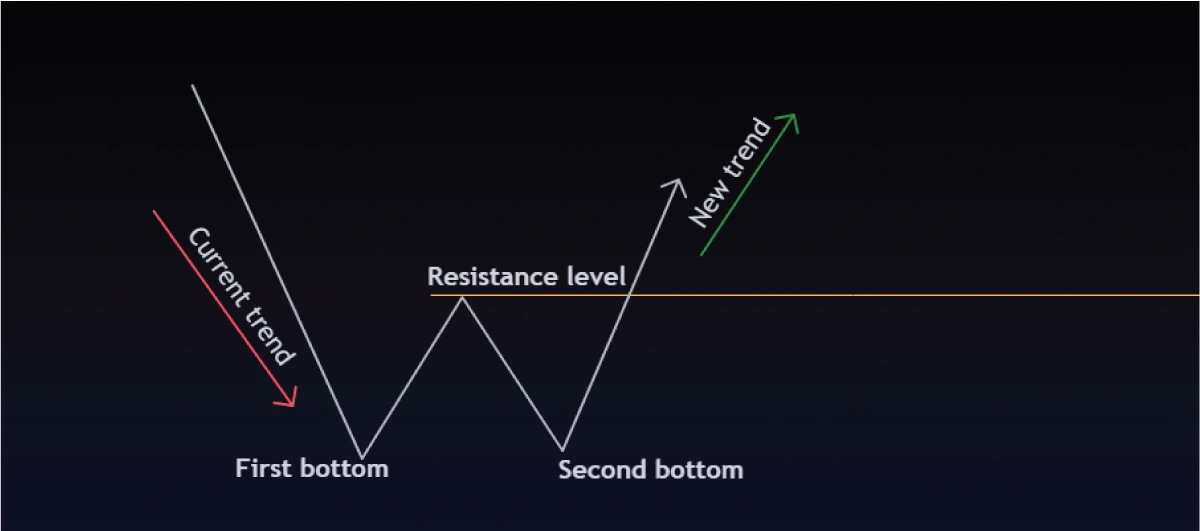
Step 5: Breakout above the Resistance Level
After forming the second bottom, the steady rally breaks above the neckline (the resistance level). This breakout confirms the double bottom chart pattern and signals a bullish reversal. Ideally, this breakout should be driven by increased volume traded.
How to Trade the Double Bottom Chart Pattern
Since the double bottom is a bullish reversal chart pattern, confirming this pattern should trigger a long position. Ideally, the entry should be above the resistance level.
The stop loss level should be below the double bottoms. If the price action drops below the level of the two bottoms, then the double bottom pattern will have failed.
Similar to when trading the double top, you can set the profit target based on the prevailing market volatility using the ATR. Alternatively, you can also use multiple timeframe analyses to identify possible resistance levels that could be optimal profit targets
The Bottom Line
The double top and double bottom chart patterns are ideal for identifying potential trend reversals and subsequently, trading breakouts. As we’ve discussed, both patterns simplify mapping out support and resistance levels, making breakout trading strategies efficient.
Arguably, the double top and double bottom chart patterns is easy to look back at historical price action and spot the formation of a pattern. But when you’re monitoring live price action, it’s impossible to know if either pattern will be successfully formed. That’s why we’ve discussed the steps you should take to ensure that each chart pattern has been successfully formed and trend reversals confirmed.