Triangle patterns form during a consolidation phase with the price action trading within a tighter range resembling the triangle. They are continuation chart patterns signaling a pause in the current trend and a possible breakout to continue the observed trend. For traders, these consolidation periods offer invaluable insights into market sentiment and identify potential breakout zones. Let’s discuss how you can use the triangle patterns when trading.
What is a Triangle Pattern in Trading?
In technical analysis, triangle patterns represent a consolidation period after a bullish or bearish trend. The resulting pattern during this phase resembles a triangle, which can be an ascending, descending, or symmetrical triangle pattern. Ideally, the price must touch at least four points of the support and resistance lines for the pattern to be considered a triangle.
The ascending triangle pattern is a bullish continuation chart pattern, and the descending triangle is a bearish continuation chart pattern. Symmetrical triangles can be bullish continuation patterns if they form in an uptrend and bearish continuation if they form in a downtrend.
Volume plays a key role when trading the triangle pattern. The preceding bullish or bearish trend is underscored by an increase in the volume traded. During the consolidation phase when the triangle forms, there’s a significant drop in the volume, which is followed by an increase in the volume during the breakout. The logic behind increased volume during breakouts is that during the consolidation phase, traders regroup in anticipation of the trend continuation.
The Ascending Triangle Pattern
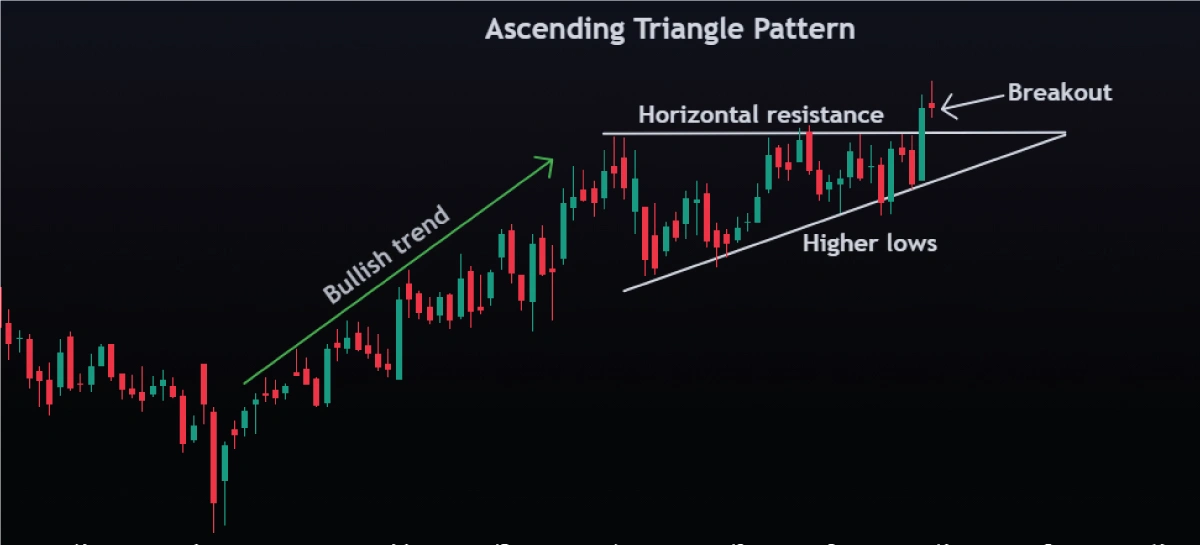
An ascending triangle pattern is a bullish continuation chart pattern. It is characterized by an ascending trendline connecting higher lows and a horizontal resistance line connecting almost equal highs.
It usually forms during the consolidation period in an uptrend in an uptrend and signals a potential continuation of the prior bullish trend. That means it forms when a bullish trend undergoes a momentary pause (the ascending triangle) before breaking out above the pattern’s resistance.
How to Identify an Ascending Triangle Pattern
The ascending triangle pattern forms when the price action forms higher lows and relatively similar highs during the consolidation phase. That means you can connect the higher lows with a rising trendline and the highs with a horizontal trendline, to form an ascending triangle.
How to Trade the Ascending Triangle Bullish Continuation
You can derive the bullish significance of an ascending triangle from its technical structure. The higher lows indicate a general increase in the buying pressure, with sellers failing to successively push the price down. For the ascending triangle pattern, the ascending trendline is the support, and the horizontal trendline is the resistance level.
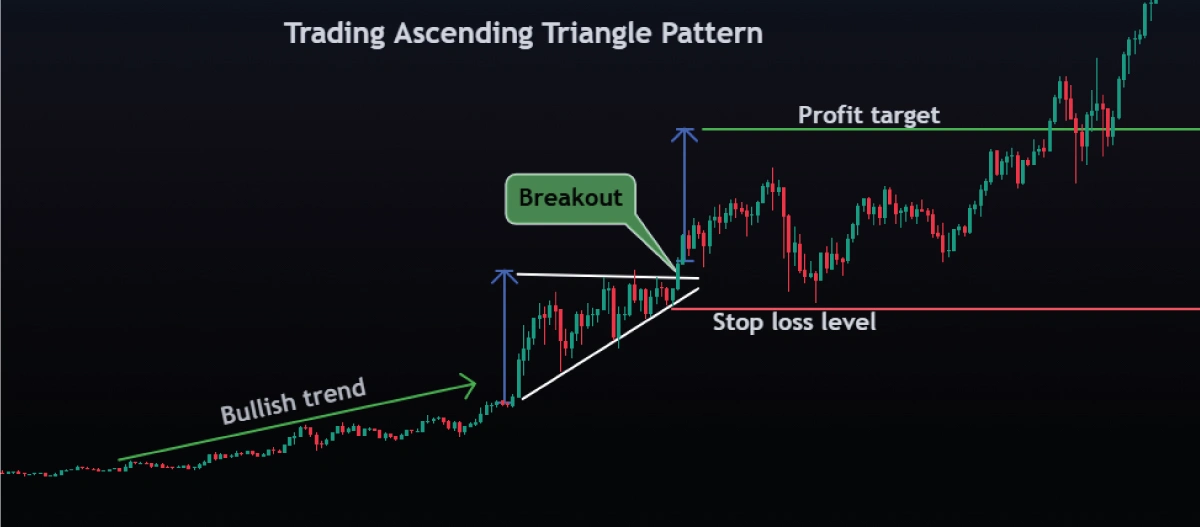
Here’s how to trade the ascending triangle pattern. Firstly, look for a confirmed breakout above the pattern’s resistance level, which must be accompanied by increased volume traded. To avoid false breakouts, ensure the price closes above the resistance, and the subsequent candle’s open is above the breakout candle’s close.
You can set your stop loss below the rising trendline or below the most recent swing low. You can measure the pattern’s height for the profit target and add it to the breakout level. Alternatively, you can use the ATR to determine the optimal exits depending on the market volatility.
The Descending Triangle Patterns
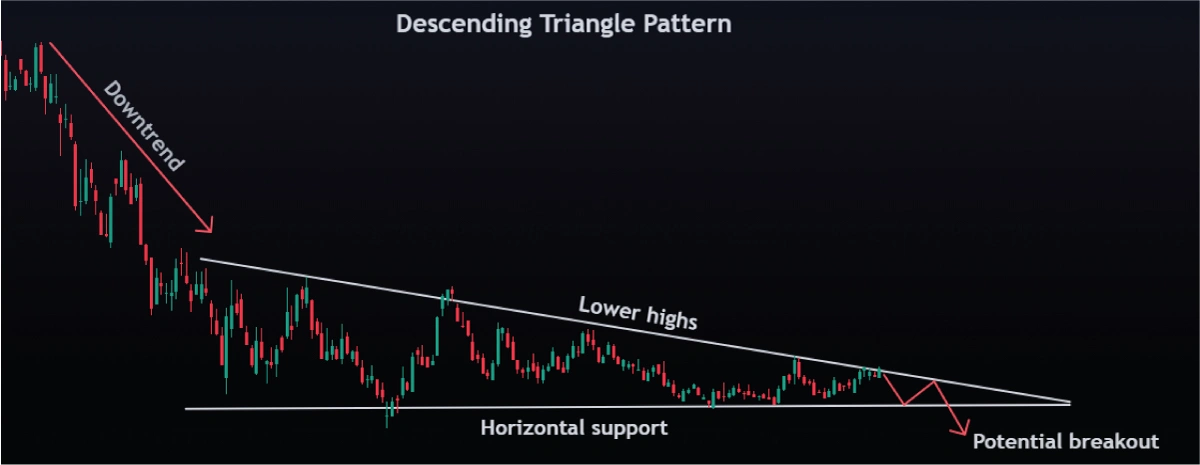
The descending triangle pattern is a bearish continuation chart pattern. It’s the exact opposite of an ascending triangle and is characterized by a descending trendline connecting lower highs and a horizontal trendline connecting nearly equal lows.
Generally, the descending triangle pattern forms during the consolidation phase in a bearish trend signaling a possible continuation of the prior downtrend. It forms when a bearish trend undergoes a momentary pause (the descending triangle) before breaking out below the pattern’s support level.
How to Identify the Descending Triangle Pattern
The descending triangle pattern forms when the price action forms lower highs and relatively similar lows during the consolidation phase. That means you can connect the lower highs with a falling trendline and the lows with a horizontal trendline to form a descending triangle.
The key elements of a descending triangle are:
- A prior strong downtrend with consistently higher traded volume
- A temporary pause in the prior bearish trend punctuated with lower highs forming a descending trendline and almost equal lows forming horizontal support.
- A breakout below the horizontal support.
Symmetrical Triangle Pattern Bullish Breakout
Bearish undertones are already present when the descending triangle pattern forms. The lower highs indicate an overall decline in the buying pressure since buyers cannot successively push prices any higher. The resistance is the descending trendline formed by connecting these lower highs, while the horizontal trendline is the support level.
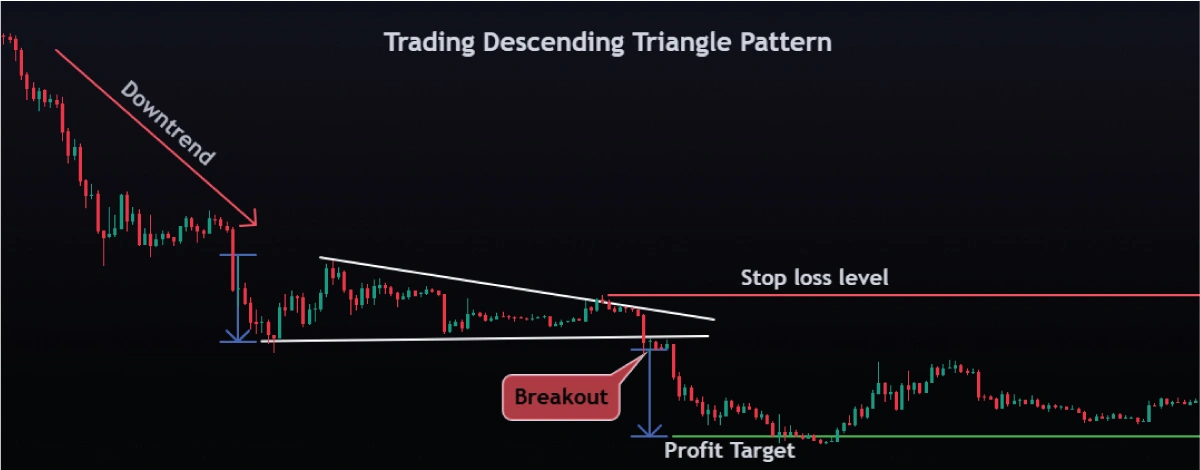
To trade the descending triangle pattern, take a short position below the horizontal support. There must be a confirmed breakout below the pattern’s support level, which must be accompanied by an increase in volume traded. To avoid potential false breakouts, make sure the price closes below the support, and the subsequent candle’s open is below the breakout candle’s close.
You can set your stop loss above the falling trendline (the resistance) or below the pattern’s most recent swing high. You can measure the pattern’s height for the profit target and subtract it from the breakout level. Alternatively, you can use the ATR to determine the optimal exits depending on the market volatility.
The Symmetrical Triangle Pattern
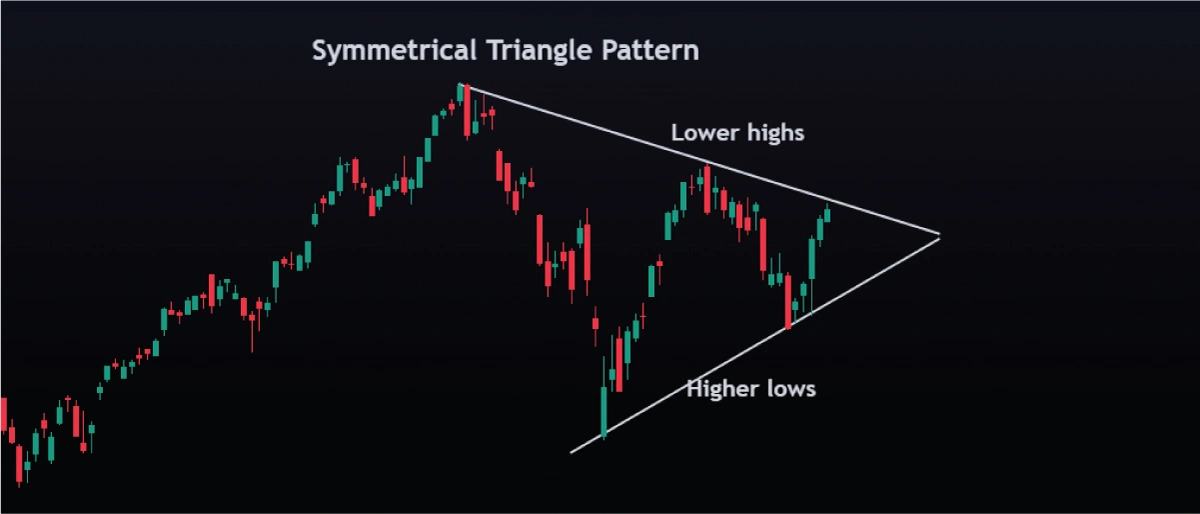
A symmetrical triangle is a bullish or bearish continuation chart pattern depending on the preceding trend. It forms during a consolidation phase of either a bullish or bearish trend, with the price action registering lower highs and higher lows.
Consequently, the trendlines are converging towards each other – a descending upper trendline and an ascending lower trendline. Note that volume declines progressively as the trendlines converge. That’s why the symmetrical triangle is often considered a neutral consolidation chart pattern, unlike the ascending and descending triangle patterns. Neither buyers nor sellers have a distinct momentum advantage during the consolidation phase.
How to Trade Descending Triangle Bearish Continuation
Ideally, if the symmetrical triangle pattern forms after a bullish trend, the potential breakout will be bullish – above the upper trendline. A valid breakout occurs when the breakout candle closes above the upper trendline.
The trading strategy for a symmetrical triangle pattern bullish breakout is similar to that of the ascending triangle pattern discussed earlier.
Symmetrical Triangle Pattern Bearish Breakout
Conversely, if the symmetrical triangle forms after a downtrend, then it’s likely that the resulting breakout will be bearish – a break below the lower trendline. Always wait until the breakout candle closes below the support level to execute a short position. Note that the trading strategy for a symmetrical triangle pattern bearish breakout is similar to that of the descending triangle pattern discussed above.
It’s important to note that with symmetrical triangles, it’s likely that the market could break out in either direction. You should, therefore, take a conservative approach when setting your entry targets.
Triangle Patterns vs Wedge Chart Patterns
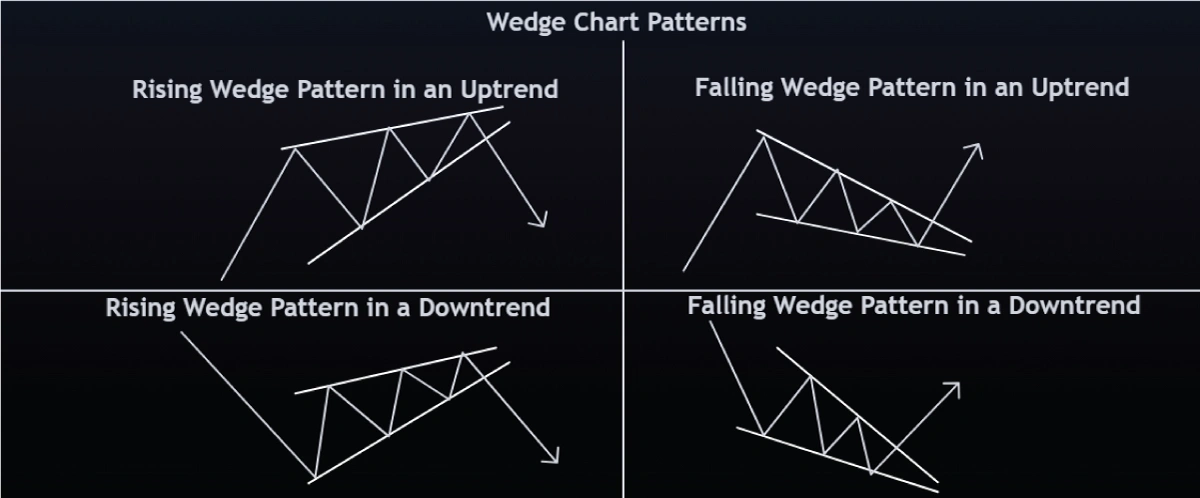
Wedges, also called asymmetrical triangles, can be rising or falling wedges. In rising wedges converging trendlines connect higher highs and higher lows. For falling wedges, the converging trendlines connect lower lows and lower highs. Wedges can form in both downtrends and uptrends.
Triangles are continuation chart patterns, while wedges can either be a continuation or reversal chart patterns depending on how and where they form in the price action. Here’s a quick comparison between wedge chart patterns and triangle patterns.
The Bottom Line
Ascending, descending, and symmetrical triangle patterns are continuation chart patterns. The ascending triangle and symmetrical triangle in an uptrend are bullish continuation chart patterns, while the descending triangle and symmetrical triangle in a downtrend are bearish continuation chart patterns. While these patterns offer credible breakout levels, in periods of high market volatility all chart patterns may be prone to invalidations. That’s why risk management when trading breakouts is important.
To avoid false breakouts when trading triangle patterns, here are two important things to keep in mind: firstly, monitor the volume traded. Volume should be lower during the consolidation phase and increase during the breakout. Secondly, for any breakout to be considered valid, the breakout candle must close below the lower trendline for bearish breakouts and above the upper trendline for bullish breakouts.


