Summary
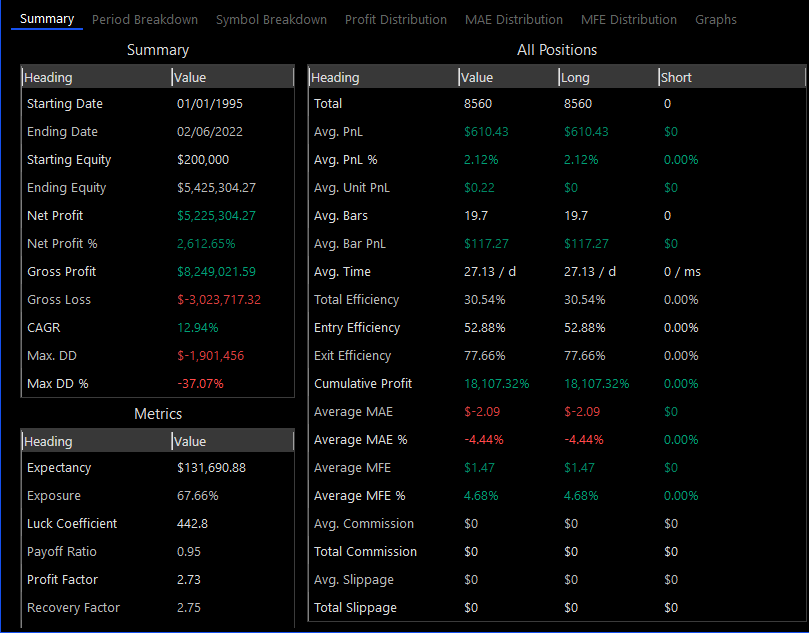
The performance summary displays extensive performance metrics for both Quant and Standard Desktops.
The summary includes the following distinct sections:
oSummary – core performance figures for the Desktop.
oMetrics – industry standard performance metrics for evaluating the Desktop strategies.
oAll Positions – performance figures that are based on all of the Desktop positions.
oWinning Positions – performance figures that are based on the Desktop winning positions.
oLosing Positions – performance figures that are based on the Desktop losing positions.
oCustom Performance Metrics - performance figures that are calculated by Performance Metric scripts.
Summary Table
The Summary table displays the core performance figures for the Desktop.
|
Name |
Description |
|
Starting Date |
The date from which the performance results are calculated. |
|
Ending Date |
The date up to which the performance results are calculated. |
|
Starting Equity |
The equity at the specified start date of the selected strategies. |
|
Ending Equity |
The equity at the specified end date of the selected strategies. |
|
Net Profit |
The net profit of the selected strategies over the specified date range. The net profit is calculated by subtracting the starting equity from the ending equity. |
|
Net Profit % |
The net profit % of the selected strategies over the specified date range. The net profit % is calculated by subtracting the starting equity from the ending equity and dividing it by the starting equity. |
|
Gross Profit |
The total profit made by the selected positions. |
|
Gross Loss |
The total loss made by the selected positions |
|
CAGR |
The Compound Annual Growth Rate is the year over year growth rate of the selected strategies over the specified date range (higher values indicate more growth) |
|
Max. DD |
The maximum drawdown of the selected strategies equity during the specified date range. The maximum drawdown is calculated as the maximum peak-to-trough of the equity, it is used for evaluating risk (lower negative values indicate more risk). |
|
Max DD % |
The maximum drawdown % of the selected strategies equity during the specified date range. The maximum drawdown % is calculated as the maximum peak-to-trough percent of the equity, it is used for evaluating risk (lower negative values indicate more risk). |
Metrics Table
The Metrics table displays the industry standard performance metrics for evaluating the Desktop strategies.
|
Name |
Description |
|
Expectancy |
The position expectancy is the expected PnL per position of the selected strategies over the specified date range (higher values indicate better returns per trade). |
|
Exposure |
The total market value divided by the total equity of the selected strategies over the specified date range (higher values indicate that more equity is constantly invested in the market). |
|
Luck Coefficient |
The ratio between the largest PnL trade and the average winning PnL trade of the selected strategies over the specified date range (higher values indicate that more luck was involved, thus lower values are better). |
|
Payoff Ratio |
The average winning trade PnL % divided by the average losing trade PnL % of the selected strategies over the specified date range (higher values indicate better returns per trade). |
|
Profit Factor |
The winning trades PnL divided by the losing trades PnL of the selected strategies over the specified date range (higher values indicate less risk). |
|
Recovery Factor |
The net profit divided by the max drawdown of the selected strategies over the specified date range (higher values mean that prices recover faster after a decline). |
|
Risk Adjusted Return |
The CAGR divided by the exposure (higher values mean better returns for the risk taken). |
|
Sharpe Ratio |
The measure of the excess return per unit of risk of the selected strategies over the specified date range (higher values indicate better return per risk, a value around or greater than 2 is considered excellent, while a value below 1 is considered unattractive). |
|
Sortino Ratio |
The measure of the excess return per unit of negative risk of the selected strategies over the specified date range (higher values indicate better return per risk, a value around or greater than 2 is considered excellent, while a value below 1 is considered unattractive). |
|
Van Tharp SQN |
The Van Tharp System Quality Number. Values: 1.6-1.9 (Poor), 2.0-2.4 (Average), 2.5-2.9 (Good), 3.0-5.0 (Excellent), 5.0-6.9 (Superb), 7.0 (Holy Grail) |
|
Ulcer Index |
The ulcer index measure of risk of the selected strategies over the specified date range (higher values indicate higher risk which means it takes longer for prices to recover after a decline). |
|
Win / Loss Ratio |
The total number of winning positions divided by the number of losing positions of the selected strategies over the specified date range (higher values are generally better but since the amounts won or lost are not calculated this figure isn't very important). |
All Positions Table
The All Positions table displays the performance figures that are based on all of the Desktop positions.
|
Name |
Description |
|
Total |
The total number of positions. |
|
Avg. PnL |
The average PnL for the positions. |
|
Avg. PnL % |
The average PnL % for the positions. |
|
Avg. Unit PnL |
The average PnL for each unit, share or contract. |
|
Avg. Bars |
The average number of bars held per position. |
|
Avg. Bar PnL |
The average bar PnL per position. |
|
Avg. Time |
The average time held per position. |
|
Total Efficiency |
The total efficiency per position (higher values indicate better efficiency). |
|
Entry Efficiency |
The entry efficiency per position (higher values indicate better efficiency). |
|
Exit Efficiency |
The exit efficiency per position (higher values indicate better efficiency). |
|
Cumulative Profit |
The cumulative profit for the positions. |
|
Average MAE |
The average MAE price per position. |
|
Average MAE % |
The average MAE % per position |
|
Average MFE |
The average MFE price per position. |
|
Average MFE % |
The average MFE % per position |
|
Avg. Commission |
The average commission paid for all positions. |
|
Total Commission |
The total commissions paid for all positions. |
|
Avg. Slippage |
The average slippage paid for all positions. |
|
Total Slippage |
The total slippage paid for all positions. |
Winning Positions Table
The Winning Positions table displays performance figures that are based on the Desktop winning positions.
|
Name |
Description |
|
Total Wins |
The number of winning positions. |
|
Winning % |
The percent of winning positions. |
|
Total Win PnL |
The total PnL of all winning positions. |
|
Max. Win PnL |
The maximum PnL for a winning positions. |
|
Max. Win PnL % |
The maximum PnL % for a winning positions. |
|
Avg. Win PnL |
The average PnL of all winning positions. |
|
Avg. Win PnL % |
The average PnL % of all winning positions. |
|
Avg. Win Bars |
The average number of bars of all winning positions. |
|
Avg. Win Bar PnL |
The average PnL per bar of all winning positions. |
|
Avg. Win Time |
The average time held per winning position. |
|
Total Efficiency (Win) |
The average total efficiency per winning position (higher values indicate better efficiency). |
|
Entry Efficiency (Win) |
The entry efficiency per winning position (higher values indicate better efficiency). |
|
Exit Efficiency (Win) |
The exit efficiency per winning position (higher values indicate better efficiency). |
|
Max. Consecutive Wins |
The maximum number of consecutive winning positions. |
Losing Positions Table
The Losing Positions table displays performance figures that are based on the Desktop losing positions.
|
Name |
Description |
|
Total Losses |
The number of losing positions. |
|
Losing % |
The percent of losing positions. |
|
Total Loss PnL |
The total PnL of all losing positions. |
|
Max. Loss PnL |
The maximum PnL for a losing positions. |
|
Max. Loss PnL % |
The maximum PnL % for a losing positions. |
|
Avg. Loss PnL |
The average PnL of all losing positions. |
|
Avg. Loss PnL % |
The average PnL % of all losing positions. |
|
Avg. Loss Bars |
The average number of bars of all losing positions. |
|
Avg. Loss Bar PnL |
The average PnL per bar of all losing positions. |
|
Avg. Loss Time |
The average time held per losing position. |
|
Total Efficiency (Loss) |
The average total efficiency per losing position (higher values indicate better efficiency). |
|
Entry Efficiency (Loss) |
The entry efficiency per losing position (higher values indicate better efficiency). |
|
Exit Efficiency (Loss) |
The exit efficiency per losing position (higher values indicate better efficiency). |
|
Max. Consecutive Losses |
The maximum number of consecutive losing positions. |