Period Breakdown
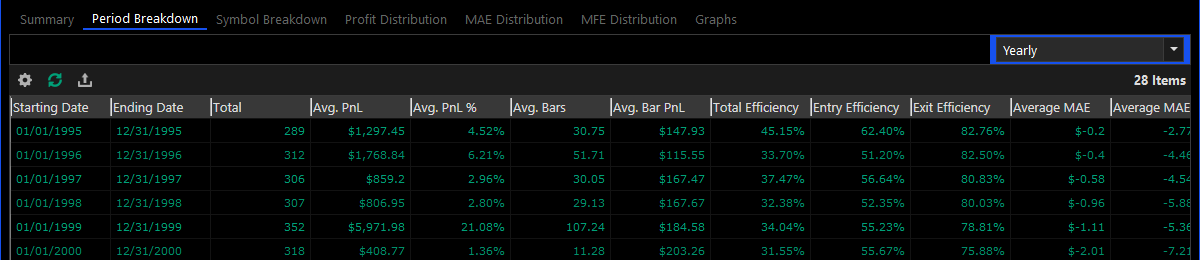
The period breakdown displays aggregated performance results for the entire Desktop over a specified period of time. Supported periods include: yearly, monthly, weekly, daily, day of week and hour of day.
|
Name |
Description |
|
Starting Date |
The date from which the performance results are calculated |
|
Ending Date |
The date up to which the performance results are calculated. |
|
Starting Equity |
The equity at the specified start date of the selected strategies. |
|
Ending Equity |
The equity at the specified end date of the selected strategies |
|
Net Profit |
The net profit of the selected strategies over the specified date range. The net profit is calculated by subtracting the starting equity from the ending equity. |
|
Net Profit % |
The net profit % of the selected strategies over the specified date range. The net profit % is calculated by subtracting the starting equity from the ending equity and dividing it by the starting equity. |
|
CAGR |
The Compound Annual Growth Rate is the year over year growth rate of the selected strategies over the specified date range (higher values indicate more growth) |
|
Max. DD |
The maximum drawdown of the selected strategies equity during the specified date range. The maximum drawdown is calculated as the maximum peak-to-trough of the equity, it is used for evaluating risk (lower negative values indicate more risk). |
|
Max DD % |
The maximum drawdown % of the selected strategies equity during the specified date range. The maximum drawdown % is calculated as the maximum peak-to-trough percent of the equity, it is used for evaluating risk (lower negative values indicate more risk). |
|
Total |
The total number of positions |
|
Avg. PnL |
The average PnL of the symbol positions. |
|
Avg. PnL % |
The average PnL % for the positions. |
|
Avg. Bars |
The average number of bars held per position. |
|
Avg. Bars PnL |
The average PnL per bar of all the symbol positions. |
|
Total Efficiency |
The total efficiency per position (higher values indicate better efficiency). |
|
Entry Efficiency |
The entry efficiency per position (higher values indicate better efficiency). |
|
Exit Efficiency |
The exit efficiency per position (higher values indicate better efficiency). |
|
Average MAE |
The average MAE price per position. |
|
Average MAE % |
The average MAE % per position. |
|
Average MFE |
The average MFE price per position. |
|
Average MFE % |
The average MFE % per position. |
|
Winning % |
The percent of winning positions. |
|
Losing % |
The percent of losing positions. |
|
Avg. Win PnL |
The average PnL of the winning symbol positions. |
|
Avg. Loss PnL |
The average PnL of the losing symbol positions. |
|
Expectancy |
The position expectancy is the expected PnL per position of the selected strategies over the specified date range (higher values indicate better returns per trade). |
|
Exposure |
The total market value divided by the total equity of the selected strategies over the specified date range (higher values indicate that more equity is constantly invested in the market). |
|
Luck Coefficient |
The ratio between the largest PnL trade and the average winning PnL trade of the selected strategies over the specified date range (higher values indicate that more luck was involved, thus lower values are better). |
|
Payoff Ratio |
The average winning trade PnL % divided by the average losing trade PnL % of the selected strategies over the specified date range (higher values indicate better returns per trade). |
|
Profit Factor |
The winning trades PnL divided by the losing trades PnL of the selected strategies over the specified date range (higher values indicate less risk). |
|
Recovery Factor |
The net profit divided by the max drawdown of the selected strategies over the specified date range (higher values mean that prices recover faster after a decline). |
|
Risk Adjusted Return |
The CAGR divided by the exposure (higher values mean better returns for the risk taken). |
|
Sharpe Ratio |
The measure of the excess return per unit of risk of the selected strategies over the specified date range (higher values indicate better return per risk, a value around or greater than 2 is considered excellent, while a value below 1 is considered unattractive). |
|
Sortino Ratio |
The measure of the excess return per unit of negative risk of the selected strategies over the specified date range (higher values indicate better return per risk, a value around or greater than 2 is considered excellent, while a value below 1 is considered unattractive). |
|
Van Tharp SQN |
The Van Tharp System Quality Number. Values: 1.6-1.9 (Poor), 2.0-2.4 (Average), 2.5-2.9 (Good), 3.0-5.0 (Excellent), 5.0-6.9 (Superb), 7.0 (Holy Grail) |
|
Ulcer Index |
The ulcer index measure of risk of the selected strategies over the specified date range (higher values indicate higher risk which means it takes longer for prices to recover after a decline). |
|
Win / Loss Ratio |
The total number of winning positions divided by the number of losing positions of the selected strategies over the specified date range (higher values are generally better but since the amounts won or lost are not calculated this figure isn't very important). |