Performance Graphs
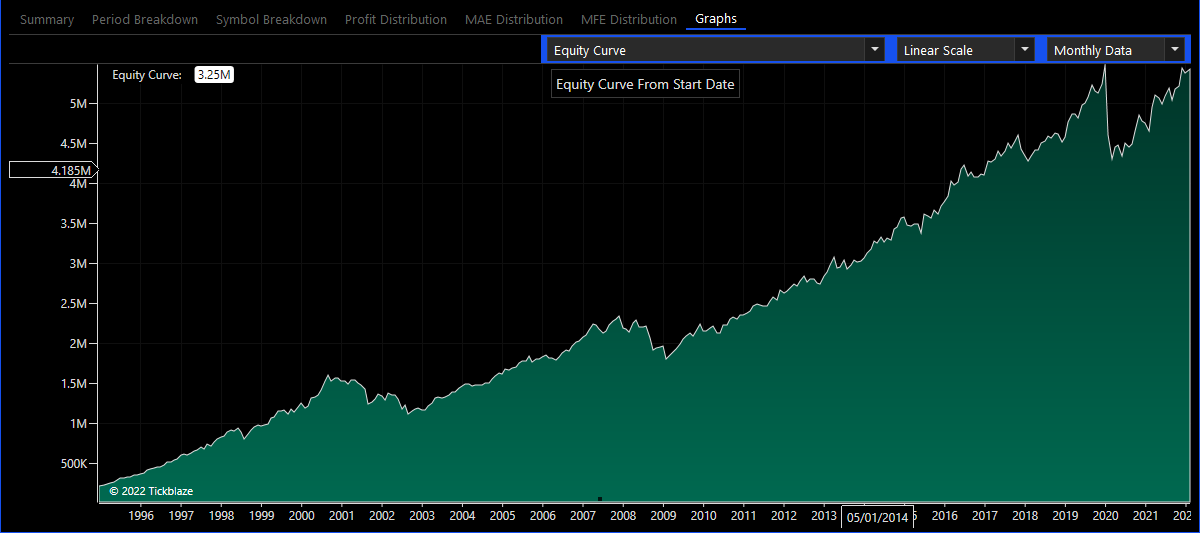
The graphs tab is used for displaying a wide selection of performance metric graphs, such as the equity curve and max drawdown. Many of the performance metrics are displayed on two separate graphs, one for plotting the metric from the Desktop start date and one for plotting it over a set period of time (month, week, day).
oGraph Selection - select the financial chart to be displayed.
oScale - select the y-axis to use for displaying the chart.
oData Aggregation - select how the data points that are used to construct the chart are aggregated
|
Name |
Description |
|
Equity Curve |
The equity sum of the selected strategies over the specified date range. |
|
Net Profit |
The net profit of the selected strategies over the specified date range. |
|
Net Profit % |
The net profit % of the selected strategies over the specified date range. |
|
CAGR |
The Compound Annual Growth Rate of the selected strategies over the specified date range. |
|
Max Drawdown |
The maximum peak-to-trough decline of the selected strategies equities over the specified date range. |
|
Max Drawdown % |
The maximum peak-to-trough percentage decline of the selected strategies equities over the specified date range. |
|
Winning/Losing |
The winning and losing trade count of the selected strategies over the specified date range. |
|
Winning/Losing % |
The winning and losing trade % of the selected strategies over the specified date range. |
|
Avg. PnL |
The average PnL of the winning and losing trades of the selected strategies over the specified date range. |
|
Avg. PnL % |
The average PnL % of the winning and losing trades of the selected strategies over the specified date range. |
|
Avg. Bars |
The average number of bars per position of the selected strategies over the specified date range. |
|
Avg. Bar PnL |
The average position bar PnL of the selected strategies over the specified date range. |
|
Total Efficiency |
The total efficiency per trade of the selected strategies over the specified date range. |
|
Entry Efficiency |
The entry efficiency per trade of the selected strategies over the specified date range. |
|
Exit Efficiency |
The exit efficiency per trade of the selected strategies over the specified date range. |
|
Expectancy |
The PnL expectancy per trade of the selected strategies over the specified date range. |
|
Exposure |
The total market value divided by the total equity of the selected strategies over the specified date range. |
|
Luck Coefficient |
The ratio between the largest PnL position and the average winning PnL position of the selected strategies over the specified date range. |
|
Payoff Ratio |
The average winning positions PnL % divided by the average losing positions PnL % of the selected strategies over the specified date range. |
|
Profit Factor |
The winning positions PnL divided by the losing positions PnL of the selected strategies over the specified date range. |
|
Recovery Factor |
The net profit divided by the max drawdown of the selected strategies over the specified date range. |
|
Risk Adjusted Return |
The CAGR divided by exposure of the selected strategies over the specified date range. |
|
Sharpe Ratio |
The measure of the excess return per unit of risk of the selected strategies over the specified date range. |
|
Sortino Ratio |
The measure of the excess return per unit of negative risk of the selected strategies over the specified date range (higher values indicate better return per risk, a value around or greater than 2 is considered excellent, while a value below 1 is considered unattractive) |
|
Van Tharp SQN |
The Van Tharp System Quality Number. Values: 1.6-1.9 (Poor), 2.0-2.4 (Average), 2.5-2.9 (Good), 3.0-5.0 (Excellent), 5.0-6.9 (Superb), 7.0 (Holy Grail) |
|
Ulcer Index |
The ulcer index measure of risk of the selected strategies over the specified date range. |
|
Win Loss Ratio |
The total number of winning trades divided by the number of losing trades of the selected strategies over the specified date range. |