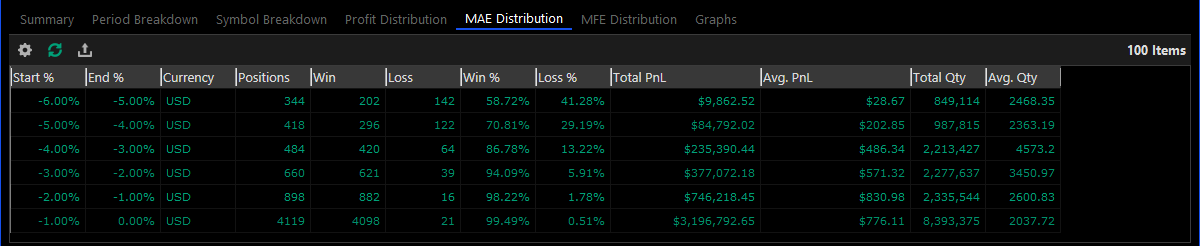
MAE Distribution
The MAE distribution table takes all of the Desktop positions and groups them together by MAE% values. Each group of positions is used for calculating various performance metrics and then displayed as a single row in the table.
The Maximum Adverse Excursion is the maximum loss that the position had before it was closed.
|
Name |
Description |
|
Start % |
The lower MAE which starts the range. |
|
End % |
The upper MAE which ends the range. |
|
Currency |
The row currency code. |
|
Positions |
The total number of positions whose MAE fits the range. |
|
Win |
The number of winning positions whose MAE fit the range. |
|
Loss |
The number of losing positions whose MAE fit the range. |
|
Win % |
The percent of winning positions whose MAE fit the range. |
|
Loss % |
The percent of losing positions whose MAE fit the range. |
|
Total PnL |
The total PnL of all the positions whose MAE fit the range. |
|
Avg. PnL |
The average PnL of all the positions whose MAE fit the range. |
|
Total Qty |
The total quantity of positions whose MAE fit the range. |
|
Avg. Qty |
The average quantity of positions whose MAE fit the range. |